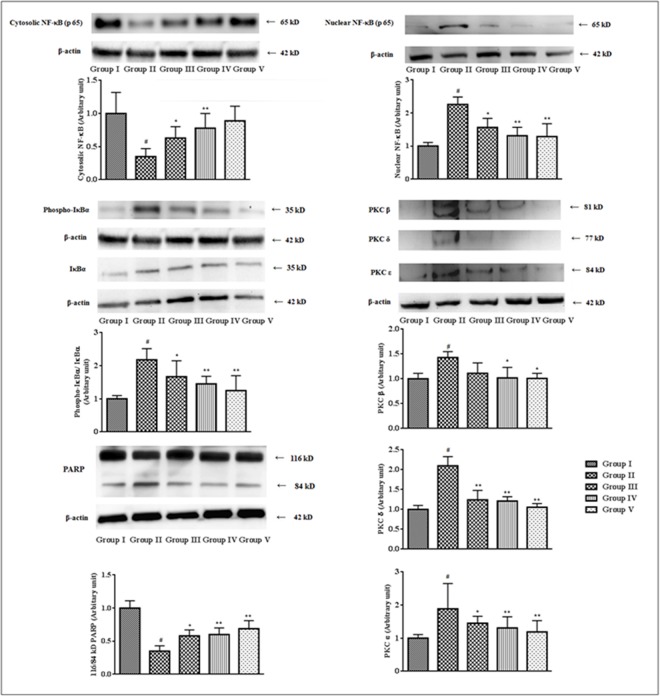
Fig 9. Effect of SR on the expressions of NF-κB, IκBα, PKC isoforms, PARP in the myocardial tissues of T2D rats.
The relative band strengths were determined and the intensities of normal control (Group I) bands were given the random value of 1. β actin was used as a loading protein. Data were expressed as mean ± SD (n = 6). $p < 0.05 compared with Group I;#p < 0.01 compared with Group I; *p < 0.05 compared with Group II; **p < 0.01 compared with Group II. Group I: Normal control; Group II: T2D control, Group III: T2D rats treated with SR (50 mg/kg, orally); Group IV: T2D rats treated with SR (100 mg/kg, orally); Group V: T2D rats treated with glibenclamide (1 mg/kg, orally).

