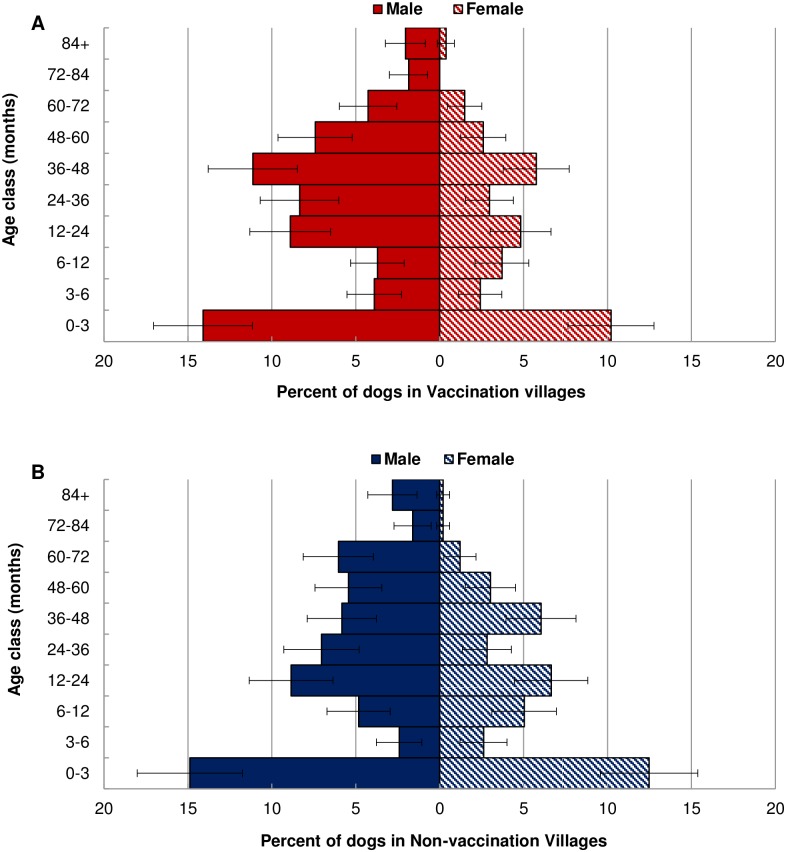
Fig 2. Age and sex distribution of dogs alive in 2013 (n = 1,028).
Percent of males (solid bars) and females (hashed bars) in each age class (months). Red bars (A) indicate vaccination village dogs and blue bars (B) indicate non-vaccination control village dogs. Error bars indicate 95% confidence intervals.

