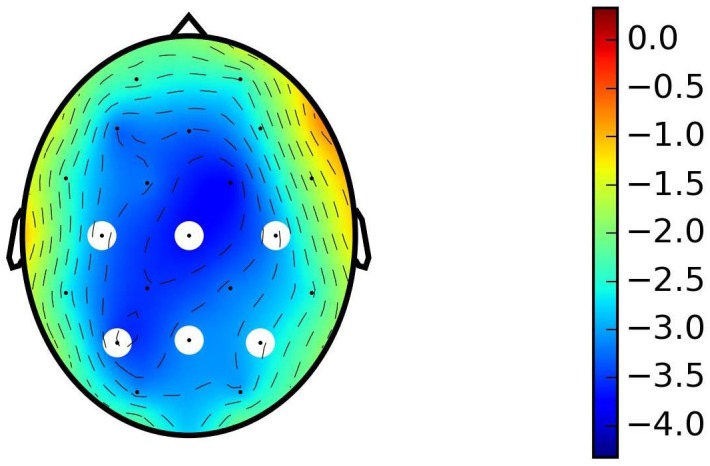
Fig 1. Scalp plot of N400 effect for control groups of both experimental versions taken together.

The N400 effect is presented as a difference between unrelated and related target words. The mean of entire time window of N400 potential (350 to 500ms) is represented. The N400 in response to the control unrelated word pairs shows greater negativity compared to the control related word pairs with the centro-parietal spatial distribution. White dots represent the locations of electrodes of interest: C3, P3 —left, Cz, Pz—central, C4, P4 —right.
