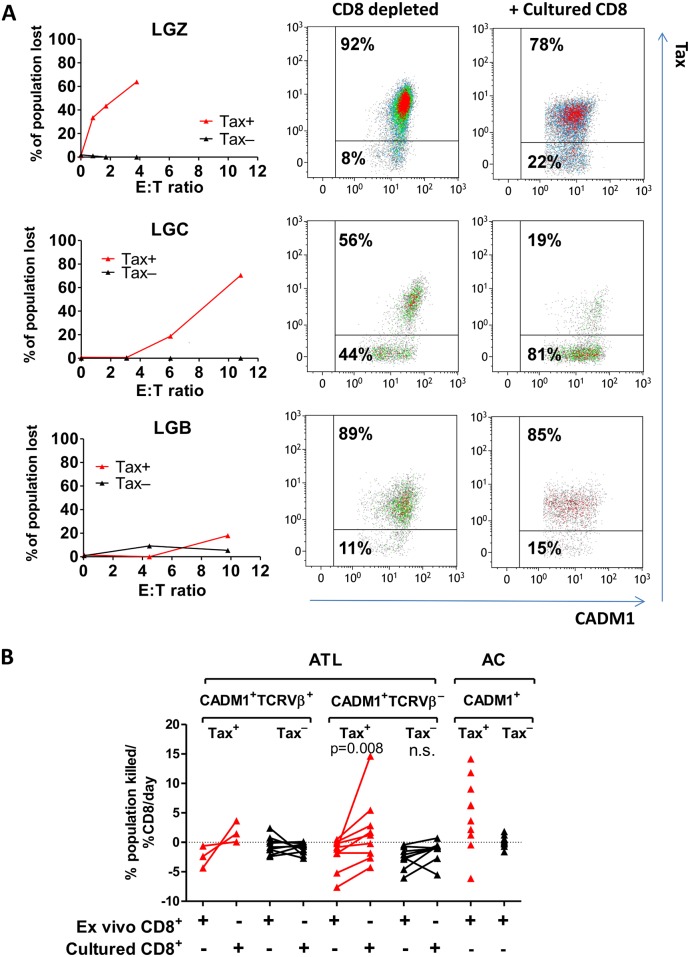
Fig 7. Tax-expressing cells are preferentially killed by cultured autologous CD8+ cells.
(A) Selective loss of live Tax-expressing ATL cells after incubation with cultured CD8+ cells. Extended analysis of data from Fig 6. ATL clones from three Taxhigh ATL patients (LGZ, LGC and LGB) were gated on the basis of Tax expression as shown. For each donor, graphs show the percentage of Tax+ or Tax−cells which were killed in the presence of cultured autologous CD8+ cells. Flow plots show Tax and CADM1 expression by live CD3+CD4+CADM1+TCRVβX+ cells from each individual after culture alone or in the presence of CD8+ cells at the highest E:T ratio tested. (B) Comparison of the rate at which ex vivo and cultured CD8+ cells supress survival of the populations indicated in ATL patients (n = 9) and ACs (n = 10). Subsets of cells which expressed Tax (in both ATL and ACs) are plotted in red. Data from Fig 6 was analysed by nonlinear regression to estimate the % change observed in each population with each 1% increase in CD8+ cells present in the co-culture. A negative rate indicates that number of viable target cells recovered from the co-culture was greater in the presence of CD8+ cells versus in the absence of CD8+ cells. Statistical analysis (CADM1+TCRVβ− groups only): Wilcoxon matched pairs test, two tailed, 95% confidence interval.

