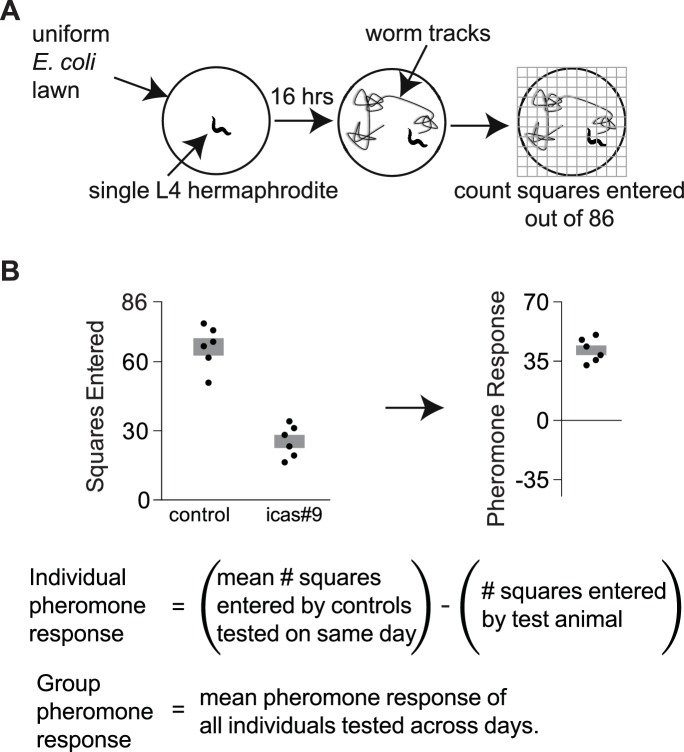
Figure 1. Exploration assays.
(A) Individual animals are allowed to explore a thinly seeded 3.5 cm plate for 16 hr, after which exploration is scored by placing the plate on a grid and counting squares with tracks (Flavell et al., 2013). Diagram from Greene et al., 2016. (B) A pheromone response for each animal on an ascaroside plate was determined with respect to the behavior of control animals that were tested on ascaroside-free plates on the same day. Data are representative values for one day of testing; boxes indicate the mean ± SEM. Below, calculating individual and group pheromone response.
DOI: http://dx.doi.org/10.7554/eLife.21454.002

