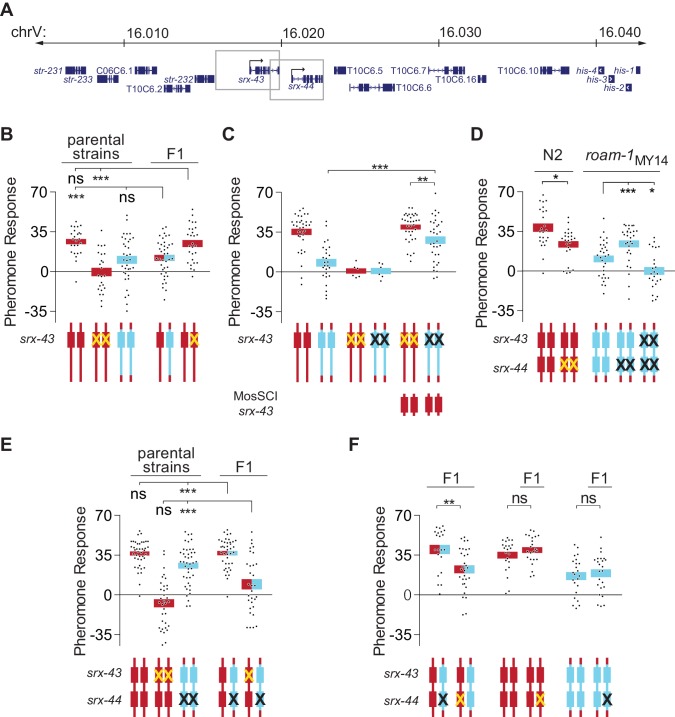
Figure 2. srx-43 and srx-44 both influence icas#9 sensitivity.
(A) The roam-1 locus. Boxes indicate genomic regions used for srx-43 and srx-44 transgenes. (B) Dominance tests. Pheromone response of parental strains and of the F1 progeny from crosses between N2 and roam-1MY14 or between N2 and N2 srx-43(lf). (C) srx-43 variation is insufficient to explain the roam-1 QTL. (D) Pheromone response of srx-44 loss-of-function mutants. (E) Complementation test between srx-43 and roam-1MY14. Pheromone response of parental strains and of F1 progeny from crosses between roam-1MY14 srx-44(lf) and N2 or N2 srx-43(lf). (F) Reciprocal hemizygosity test for srx-44. Left, pheromone response of the F1 progeny from crosses between N2 and roam-1MY14 srx-44(lf) and between N2 srx-44(lf) and roam-1. Center and right, hemizygosity for srx-44 in the parental strains did not affect behavior. For Figure B–F, boxes indicate the mean pheromone response ± SEM. Box color indicates genotype at the roam-1 locus (Red = N2; Blue = MY14; red and blue = heterozygous). Cartoons of the roam-1 locus show endogenous srx-43 (B–F) and srx-44 (D–F) with the same color code. X indicates null allele. In C, ‘MosSCI srx-43’ indicates strains with a chromosome II Mos1 Single Copy Inserted srx-43 allele from N2.. ***p<0.001,**p<0.01, *p<0.05; ns, not significant by ANOVA with Dunnett correction (A, D- roam-1MY14, E) or t-test (C, D- N2, F).
DOI: http://dx.doi.org/10.7554/eLife.21454.004

