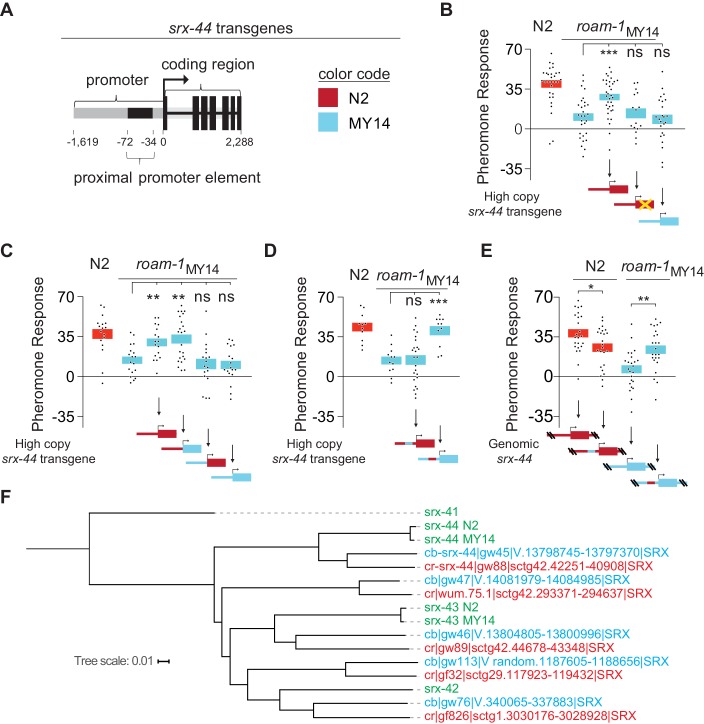
Figure 3. The proximal promoter sequence underlies altered srx-44 activity in MY14.
(A) Cartoon of srx-44 transgenes (corresponds to grey box in Figure 2A). (B) N2 srx-44 transgenes confer icas#9 sensitivity on roam-1MY14. Similar transgenes bearing a frameshift in the coding region do not, nor do MY14 srx-44 transgenes. (C) srx-44 transgenes with a N2 promoter confer icas#9 sensitivity on roam-1MY14, whereas srx-44 transgenes with a MY14 promoter do not. (D) The proximal promoter element accounts for N2 srx-44 activity in the transgene assay. (E) icas#9 responses of Allele Replacement Lines for the srx-44 proximal promoter element, generated by homologous recombination in the endogenous genomic locus with CRISPR/Cas9, localize activity to the proximal promotor element. (F) Phylogeny constructed for the coding sequence of srx-43, srx-44 and related genes in C. elegans, C. briggsae, and C. remanei. The srx-44 alleles in N2 and MY14 are closely related, confirming they are alleles of a single gene. Genes are color coded by species (green = C. elegans, blue = C. briggsae, orange = C. remanei). Protein sequences and gene names are from Thomas and Robertson (2008). For B-E, boxes indicate the mean pheromone response ± SEM. Box color in the data panels indicates genotype at the genomic roam-1 locus (Red = N2; Blue = MY14). Transgenes and allele replacements are indicated in cartoons with the same color code. ***p<0.001,**p<0.01,* p<0.05, ns = not significant by ANOVA with Dunnett correction (B, C, D) or by t test (E).
DOI: http://dx.doi.org/10.7554/eLife.21454.006

