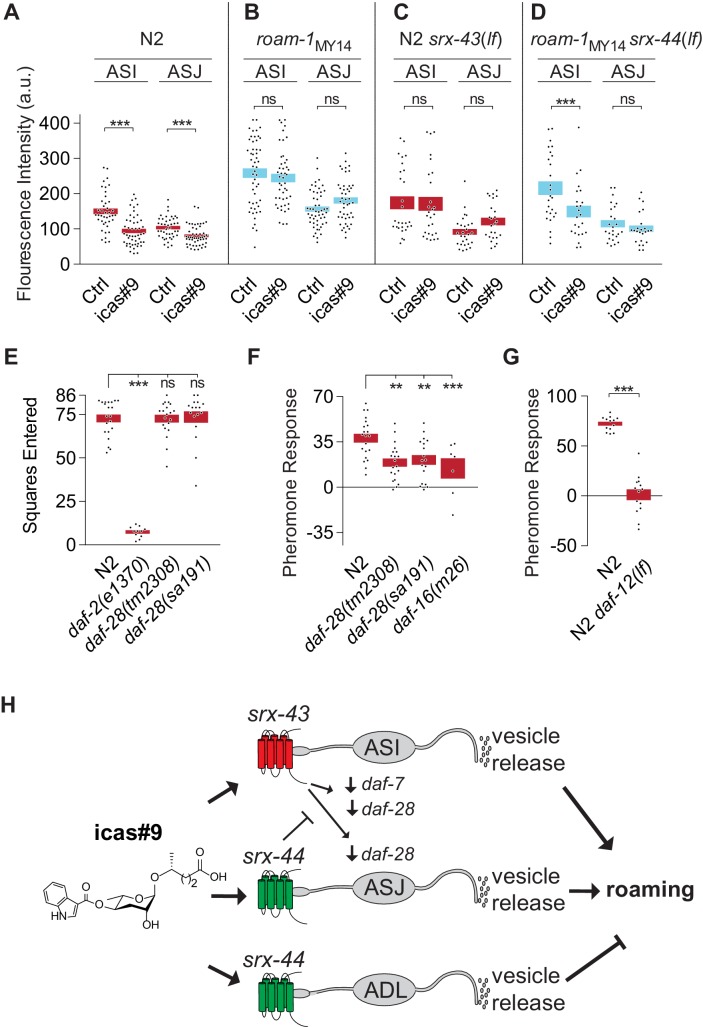
Figure 5. srx-43 and srx-44 regulate insulin and TGF-β endocrine signaling pathways.
(A–D) Effect of icas#9 on ASI and ASJ daf-28::GFP expression in N2, roam-1MY14, N2 srx-43(lf), and roam-1MY14 srx-44(lf) animals. Bars indicate mean fluorescence intensity ± SEM. (E) Exploration in the absence of pheromones in insulin pathway mutants, expressed as mean squares entered ± SEM. ***p<0.001, ns = not significant by ANOVA with Dunnett correction. (F) Pheromone response of insulin pathway mutants expressed as mean ± SEM. (G) daf-12, a convergence point of daf-7 (TGF-beta) and daf-28 (insulin) signaling in development, is necessary for icas#9 modulation of foraging behavior. Bars indicate icas#9 response expressed as mean ± SEM. (H) Schematic of the proposed relationships between icas#9, the chemoreceptors srx-43 or srx-44, the sensory neurons ASI, ASJ or ADL, alterations in insulin and TGF-beta gene expression, vesicle release, and roaming behavior. SRX-43 and SRX-44 confer sensitivity to icas#9, which leads to changes in gene expression both within the sensing cell and within other sensory neurons. Activation of SRX-43 in ASI reduces the expression of daf-7 (TGF-beta) and daf-28 (insulin) genes as shown in Figure 5A and C and in Greene et al. (2016). The activity of SRX-44 can antagonize this effect as shown in Figure 5B and D. Vesicle release from the sensory neurons, potentially releasing DAF-7, DAF-28, or other neurotransmitters or neuropeptides, can stimulate roaming at baseline (ASI; shown in Figure 4D), stimulate roaming in the presence of icas#9 (ASJ; Figure 4C), or inhibit roaming in the presence of icas#9 (ADL; Figure 4C). Boxes indicate the mean ± SEM, color indicates genotype at roam-1 locus (red = N2, blue = MY14). ***p<0.001,**p<0.01, ns = not significant by t test (A, D) or by ANOVA with Dunnett correction (B, C).
DOI: http://dx.doi.org/10.7554/eLife.21454.010


