Figure 6.
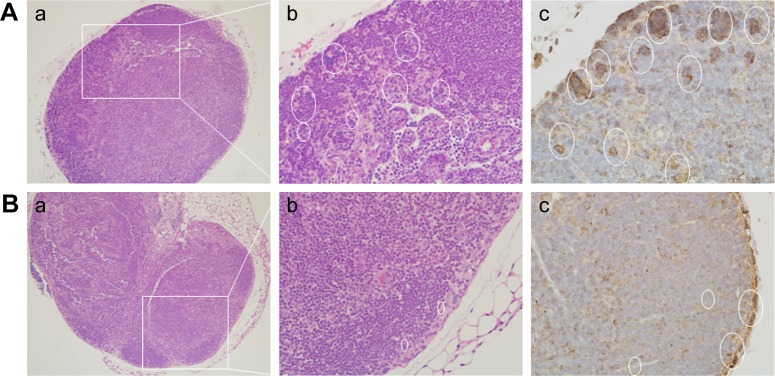
Histological observation (a, b) and immunohistochemical staining (c) of F4/80 in lymph node tissue sections.
Notes: (A) Experimental group (35 mg/kg dosage group); (B) control group (saline-treated group). Magnifications: (a) 100×; (b, c) 400×. White ovals indicate F4/80 positive cells. The white panes indicate amplified fields.

