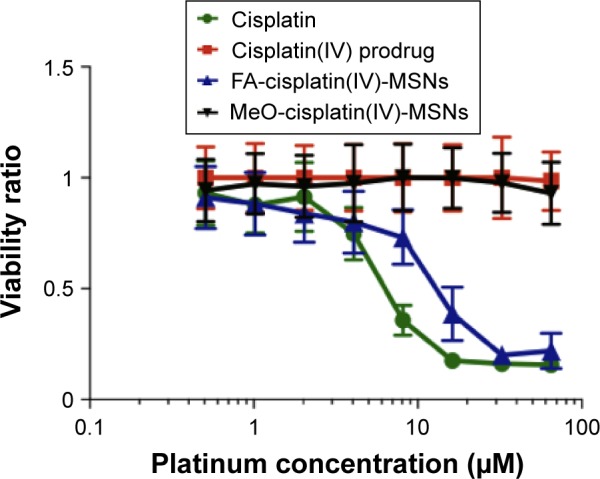
Figure 8.

Dose–response curve.
Notes: HeLa cells were exposed to varying concentrations of platinum for 48 hours. Error bars represent the standard deviation of five independent experiments.
Abbreviations: FA, folic acid; MSNs, mesoporous silica nanoparticles; MeO, methoxy.
