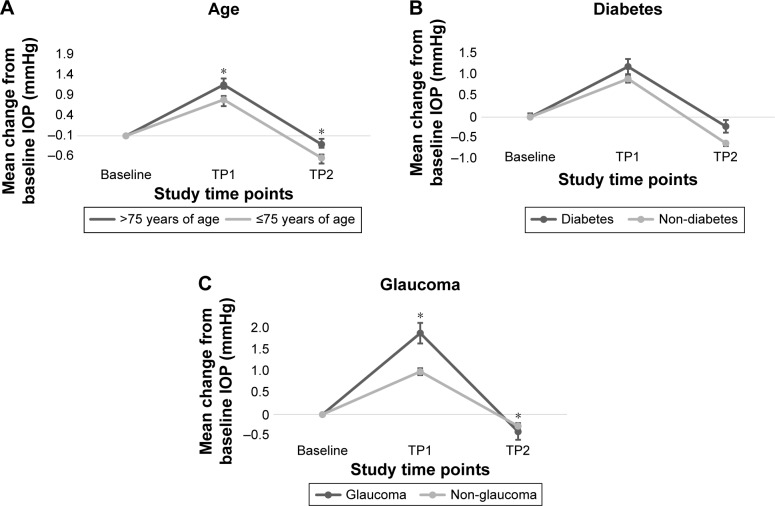
Figure 2.
Mean change (SE) in IOP (mmHg) from baseline in the total patient population.
Notes: Data stratified by (A) age categories, (B) diabetes status, and (C) glaucoma status. *Analysis of covariance adjusting for baseline IOP to report P-values of <0.05 for the difference in mean change in IOP from baseline at each study time point.
Abbreviations: IOP, intraocular pressure; SE, standard error; TP1, 5–10 days postoperatively; TP2, 3–6 weeks postoperatively.

