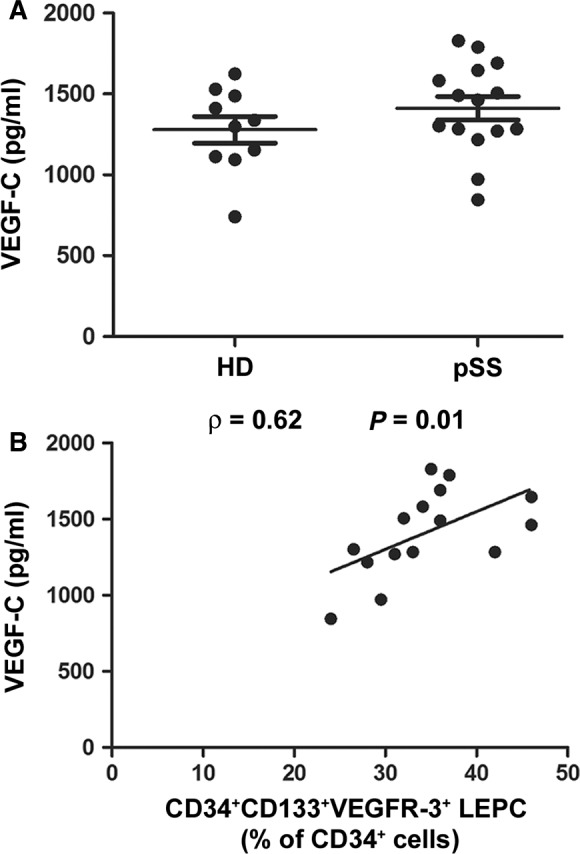
Figure 3.

(A) Serum levels of VEGF‐C determined by ELISA. Serum VEGF‐C levels are comparable in patients with primary Sjögren's syndrome (pSS) and healthy donors (HD). Data are shown as dot plots with mean ± S.E.M. Each dot represents a participant. Mann–Whitney U‐test was used for statistical analysis. (B) In pSS, serum VEGF‐C concentration is directly correlated to the percentage of circulating CD34+ CD133+ VEGFR‐3+ lymphatic endothelial precursor cells (LEPCs) as determined by Spearman's rho correlation coefficient. Data are shown as a scatterplot, each dot representing a patient.
