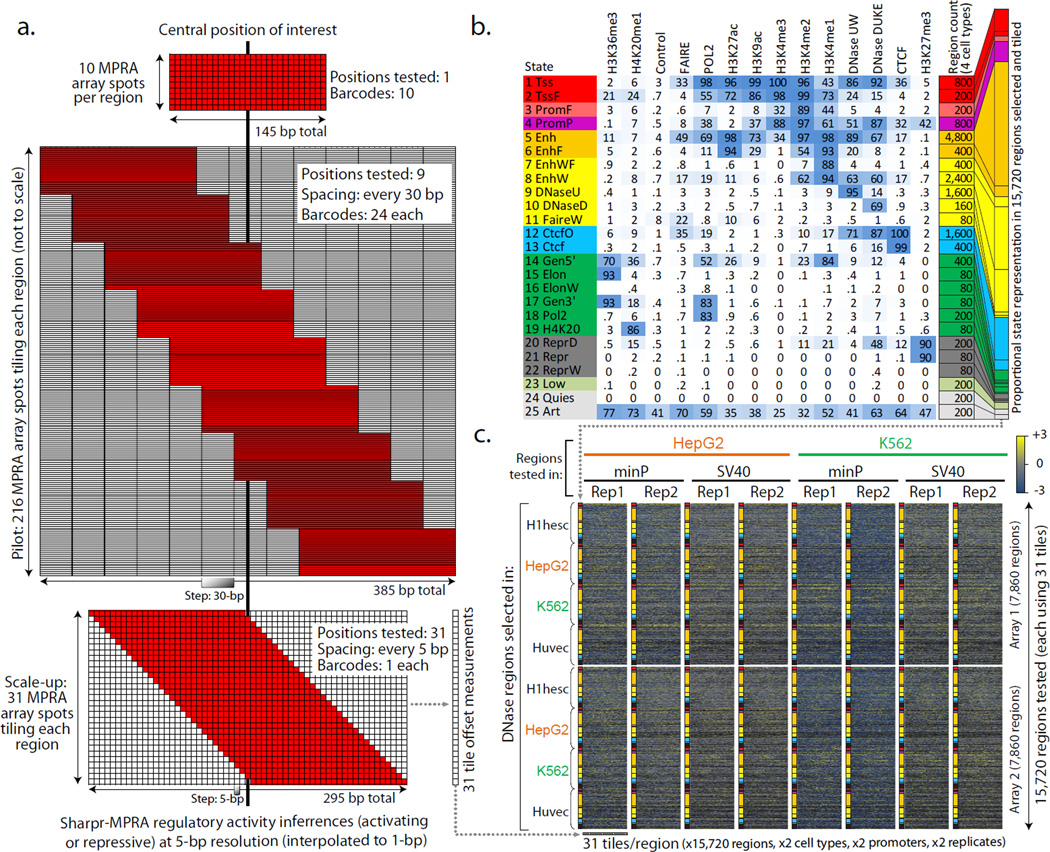
Figure 1. Experimental Design.
(a) Comparison of MPRA strategies for testing regulatory regions. Non-tiling approaches (top, e.g. Ref.30) use multiple barcodes for the same tested sequence. Our pilot design (middle) tests each region using 9 tile offsets, spaced at 30-bp increments, each tested using 24 barcodes (216 MPRA array spots per region). Our scaled-up design (bottom), tests each region using 31 tile offsets spaced at 5-bp increments, each tested using a single barcode per tile offset. The designs are to scale along the horizontal dimension. Only top and bottom are to scale in the vertical dimension. (b) The 25 chromatin states used in selecting regulatory regions for testing in the scale-up design38,39 (Supplementary Fig. 5). Heatmap indicates the emission probabilities (scaled between 0 and 100) for each epigenomic feature (columns) in each chromatin state (rows). Tested regions were restricted to DNase sites in one of four cell types, with the number of regions selected based on a stratified random sampling as indicated. (c) Overview of experiments using the scale-up design (see Supplementary Fig. 1 for the pilot design). We carried out 16 experiments, consisting of two sets of 7860 regions (row groups) across 25 chromatin states (colors), with 31 tiles per region (individual columns), each tested in both HepG2 (orange) and K562 (green), each using both a minimal promoter and an SV40 promoter, each in two replicates. Heatmap shows MPRA reporter gene expression measurements (blue=low, yellow=high, black=missing) (Supplementary Data 3).

