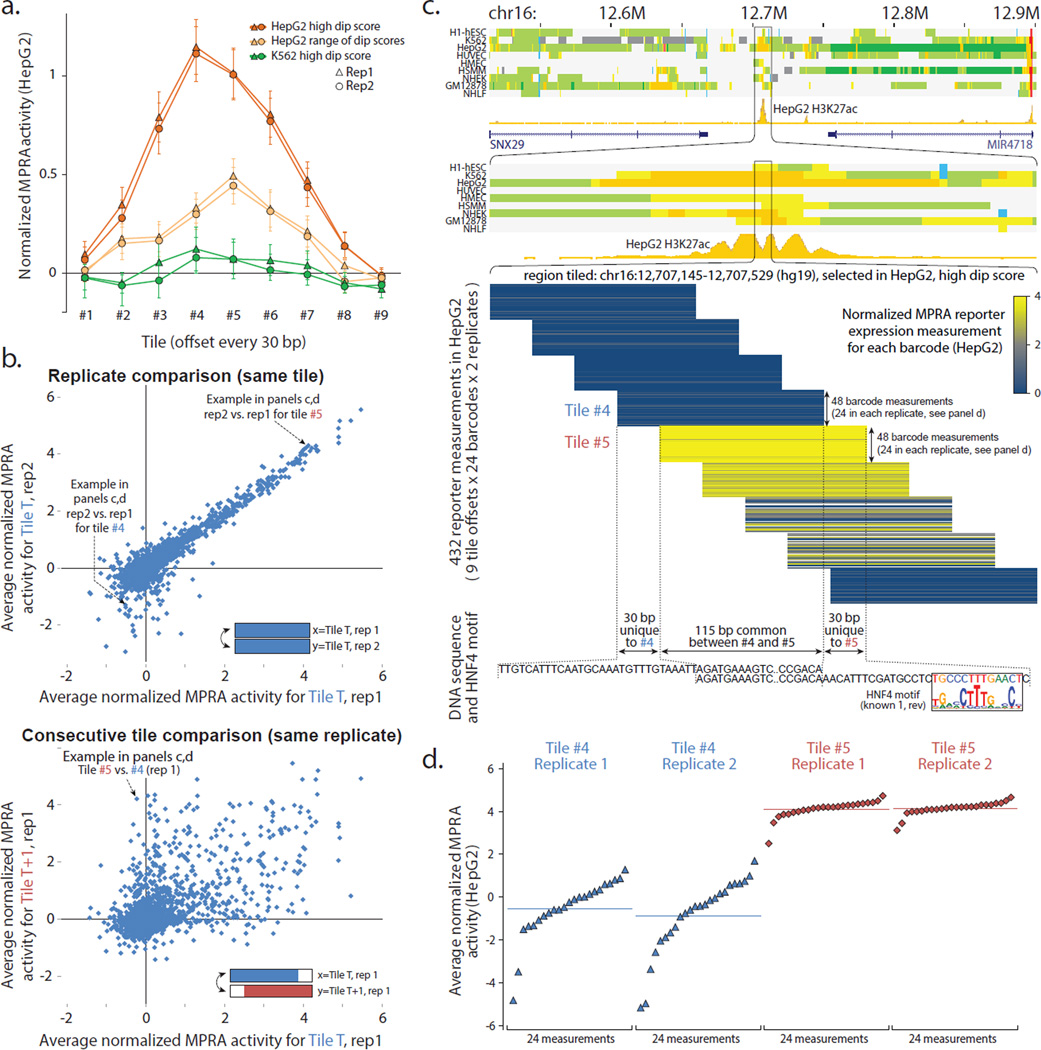
Figure 2. Tiling enhancer regions in pilot design reveals regulatory segments at 30-bp resolution.
(a) Effect of tile offset and H3K27ac dip score on reporter expression. Average HepG2 reporter expression (y-axis) at each of nine offsets (x-axis) for three sets of regions (color): HepG2 candidate enhancers2 with the highest H3K27ac dip scores (orange), candidate enhancers with a range of dip scores (light orange), and regions that are not predicted enhancers in HepG2 but are predicted enhancers with a high dip score in K562 (green). Error bar height is one standard error. (b) Consecutive tiles can differ in reporter expression. Top: Comparison of median reporter activity between biological replicates in HepG2. Only first eight tile offsets shown. Bottom: Comparison of consecutive tiles T (x-axis) and T+1 (y-axis) for the same biological replicate (rep1). (c) Top: Chromatin state annotations2 in nine cell types and H3K27ac signal track in HepG2 over the 500kb and 10kb surrounding the tiled 385-bp region centered in the H3K27ac dip. Middle: Expanded view of tile reporter measurements (yellow blue color) across all nine tiles, 24 barcodes, and two replicates. Bottom: Tiles #4 and #5 share 115-bp in common (abbreviated), and have 30-bp unique to #4 or #5 (shown), indicating the potential presence of activating elements in the sequence unique to #5 and/or repressive elements in the sequence unique to #4. Indeed, the 30-bp segment unique to #5 contains a candidate binding site for HNF4, a known activator of liver-related functions. (d) Expanded view of expression activity measurements for consecutive tiles #4 and #5 for all individual barcodes (points), sorted by their reporter expression levels. For Replicate 1 of Tile #4, 1 of 24 barcode measurements failed. The y-axis coordinates correspond to the ones shown in panel b. See Supplementary Figs. 2–4 for additional results on the pilot design.

