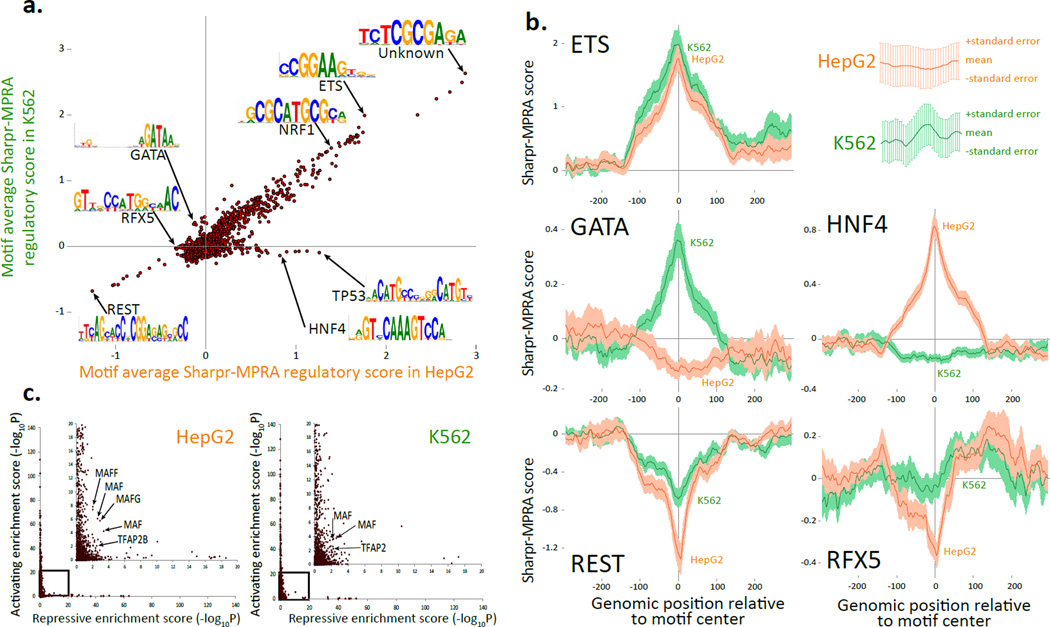
Figure 4. Comparison of Sharpr-MPRA with motif annotations.
(a) Comparison of average Sharpr-MPRA score for regulatory motifs from a previously assembled compendium13 (points) in HepG2 (x-axis) vs. K562 (y-axis), averaged at the center position of all instances for each motif. Arrows highlight motif examples mentioned in the text (Supplementary Table 2). Only motifs with more than 10 instances are shown. (b) Aggregation plots of the regulation score (y-axis) at increasing varying genomic positions relative to the motif center (x-axis) for K562 (green) and HepG2 (orange) for all motif instances, predicted independently of cell type in Ref 13, for ETS_known9, GATA_known14, REST_known2, HNF4_known18, and RFX5_known6 regulatory motifs. Error bar height is one standard error. (c) Activating enrichment score (y-axis) and repressive enrichment score (x-axis) for the regulatory motif compendium13 (points) in HepG2 (left) and K562 (right), based on the statistical significance (−log10P) for the enrichment of the center motif position for nucleotides with Sharpr-MPRA scores ≤−1 (repressive) or ≥1 (activating), using a one-sided binomial test. Inset expands boxed region, and does not cover any points, as no motif was enriched beyond −log10P=20 for both activating and repressing positions. Arrows highlight members of MAF and AP-2 motif families discussed in text. Similar plots using top 5% activating and repressive nucleotides in Supplementary Fig. 29.

