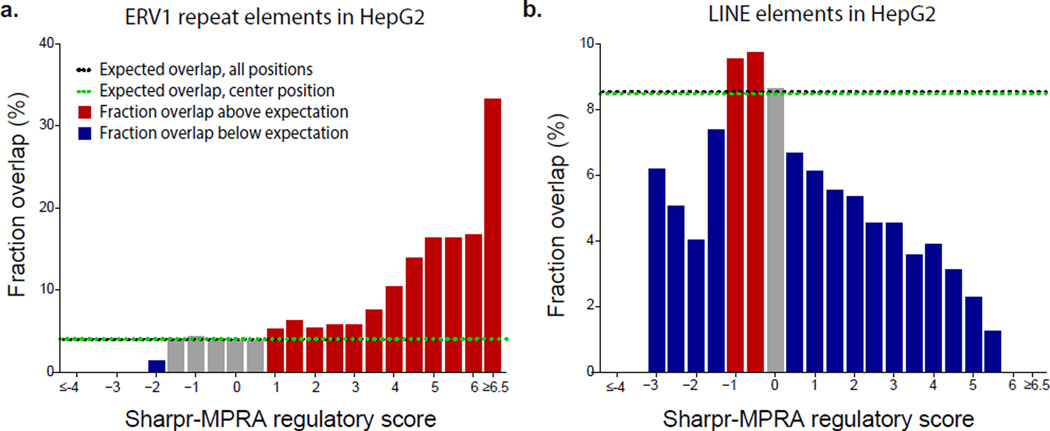
Figure 5. Regulatory activity of ERV1 and LINE repeats.
For nucleotides of varying Sharpr-MPRA regulatory activity score in HepG2 cells (x-axis bins) the fraction that overlaps with annotated repeat elements (y-axis) shows a strong ERV1 repeat enrichment at the most activating nucleotides (panel a) and a depletion for LINE repeats at the most activating and most repressive nucleotides (panel b). Bins formed by assigning each base to the nearest 0.5 value based on its regulatory score. Extreme bins contain extreme values as indicated. Horizontal lines denote expected overlap based on center position (CenPos, green), and all positions (black). Enrichments and depletions for K562 and for additional repeats shown in Supplementary Fig. 30.

