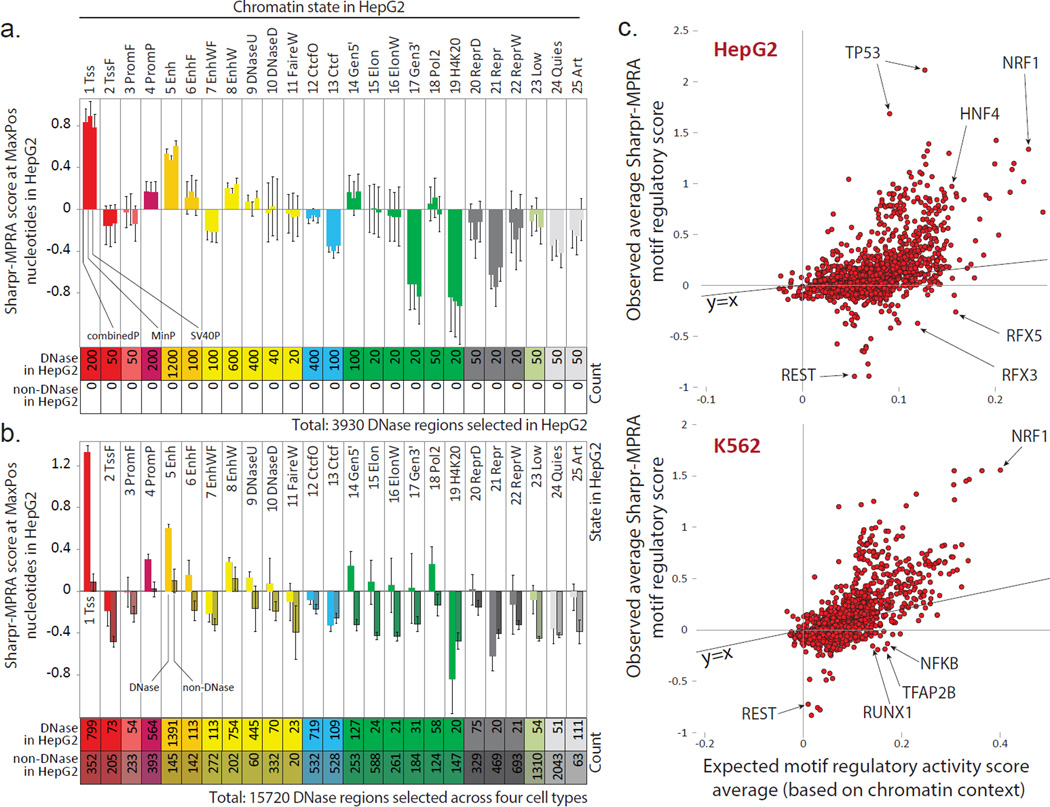
Figure 6. Endogenous chromatin state is predictive of reporter activity.
(a,b) Average HepG2 Sharpr-MPRA regulatory score (y-axis) and standard error (vertical error bars) for each chromatin state (columns) for (a) all 3930 DNase regions selected in HepG2 and (b) all 15,720 regions selected in all four cell types, evaluated at nucleotide positions of maximum absolute activity (MaxPos). In panel a, each group of consecutive bars shows the combinedP, minP, and SV40P results. All 3930 regions correspond to DNase sites in HepG2, as they were selected in HepG2. In panel b, the combinedP score is shown separately for regions corresponding to DNase sites in HepG2 (light shading) and non-DNase sites in HepG2 (darker shading). Some DNase sites selected in other cell types were also DNase in HepG2, leading to an increased DNase count compared to panel a. All non-DNase regions in HepG2 were DNase regions in the cell type in which they were selected. The chromatin state of the center position is shown. K562 plots in Supplementary Fig. 31. (c) For all motifs (Ref 13) (circles) in HepG2-selected regions (top) and K562-selected regions (bottom), relationship between their average combinedP Sharpr-MPRA score in the corresponding cell type (y-axis) and their expected score based on the chromatin states in which the motif occurs (x-axis), quantified as the median of randomized motif occurrences that preserve positional and chromatin state distributions (see Methods). Only motifs with 20 or more evaluated instances in selected regions are shown. Diagonal line shows y=x line. Randomization 95th percentile confidence intervals shown in Supplementary Fig. 39.

