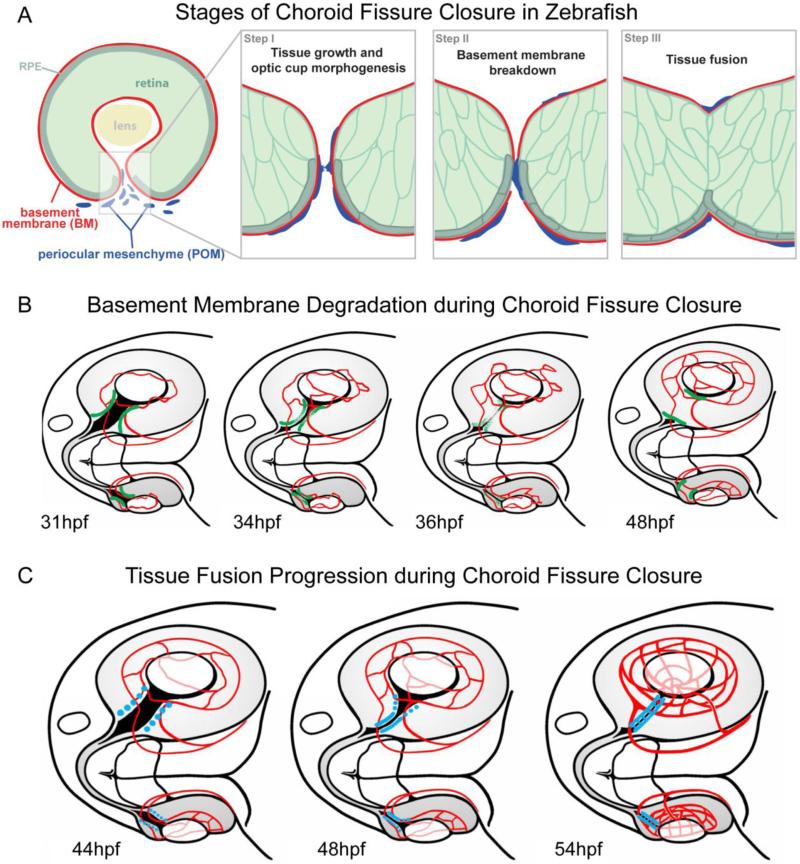
Figure 7. Schematics depicting key stages and events of CFC.
(A) During Stage I, tissue growth and optic cup morphogenesis generates an appropriate number of cells, which are correctly patterned and positioned in the optic cup. The opposing sides of the CF become closely apposed. During Stage II, the basement membrane lining the CF is degraded through a process involving periocular mesenchyme cells. During Stage III, tissue fusion between opposing sides of the CF closes the fissure. (B) Schematic of basement membrane breakdown (green = BM) within the CF from 31-48hpf. BM breakdown initiates in the central/proximal CF and proceeds bi-directionally, being complete by 48hpf except in the most distal regions of the CF. (C) Schematic of tissue fusion (blue = fusion) in the CF from 41-54hpf. The hyaloid vasculature is depicted in red in each image. Fusion initiates in the central/proximal CF and proceeds bi-directionally, being complete by ~54hpf except in the most distal regions of the CF.

