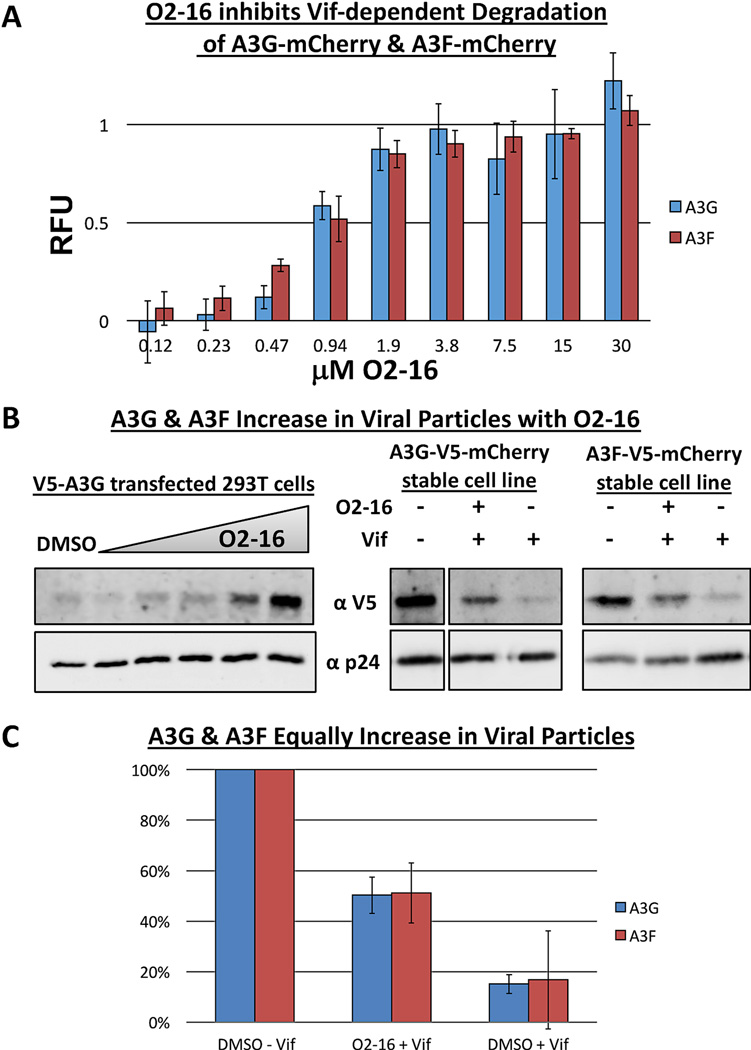
Fig. 2. O2-16 inhibits Vif-dependent degradation and viral packaging of A3G and A3F.
(A) A dose-response for O2-16 (0.12–30 µM) displaying RFU in a Vif-dependent A3G-mCherry and A3F-mCherry degradation assay (described in Fig. S3), n=3 with error bars showing SD. (B) On the left shows the O2-16 dose-dependent increase in V5-A3G in pseudotyped HIV viral particles with p24 acting as the viral load control, with the DMSO control in lane 1 and lanes 2–6 showing increasing concentrations of O2-16 (2.1, 4.2, 8.3, 16.7, 33.3 µM); on the right shows viral particles isolated from A3G-V5-mCherry and A3F-V5-mCherry cells infected with −Vif virus, or +Vif virus with or without O2-16 (33 µM) treatment (NOTE: A3G-V5-mCherry −Vif lane is in a separate panel from the +Vif conditions, but all conditions are from the same gel and exposure with lanes in middle removed). (C) Quantification of densitometry measurements of the conditions from B (right) from three separate viral isolation experiments. The ratio of A3G or A3F to p24 in the −Vif control was set to 100%, + Vif conditions with and without O2-16 are shown with error bars representing SD (n=3).

