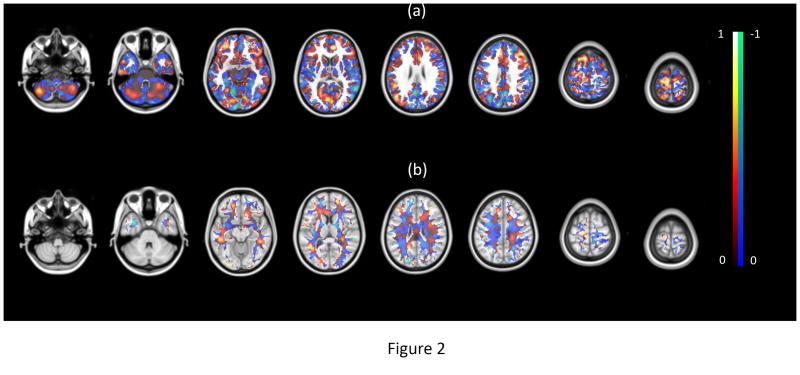
Figure 2.
The discriminatory map for (a) GM and (b) WM classifier. The red and blue color maps indicate voxels with a corresponding positive and negative value, respectively. According to MNI template (2mm), the z coordination of the axial slices is -50, -32, -12, 10, 26, 40, 62 and 74, respectively.

