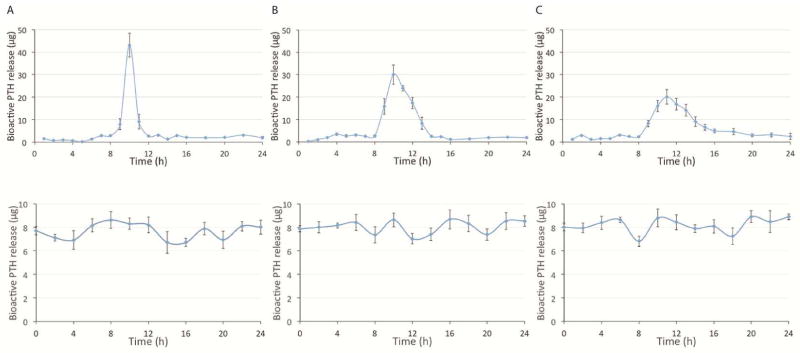
Figure 4.
In vitro bioactive PTH release curves from the two different delivery devices. cAMP-binding assays were used to determine the bioactive PTH amounts released from a pulsatile device (upper panel) and a continuous device (lower panel) at 3 time points: (A) day 1, (B) day 10, and (C) day 20 (n=3).

