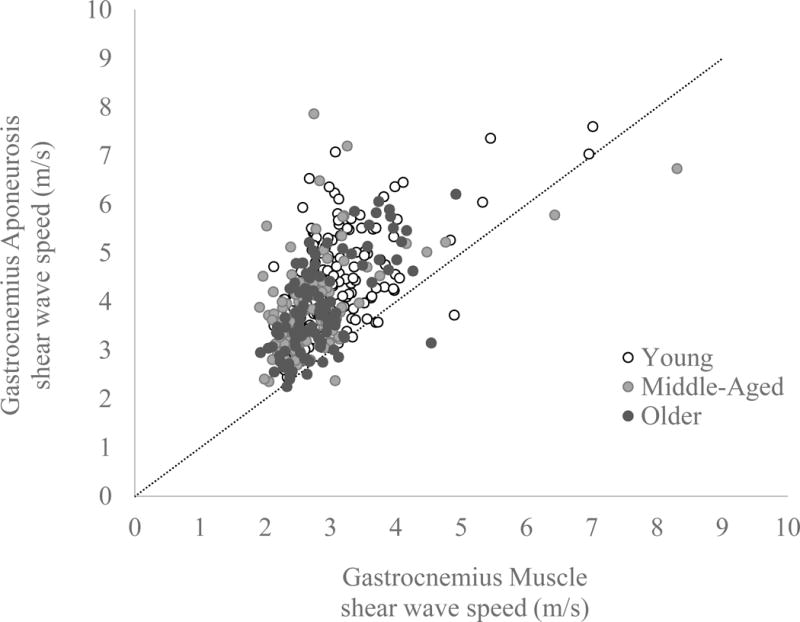
Figure 5.

Resting gastrocnemius aponeurosis shear wave speed is plotted versus resting gastrocnemius muscle wave speed for all subjects, with a 1:1 line for reference. Multiple data points per subject are plotted from the different locations proximal to the gastrocnemius muscle-tendon junction, with different colours representing the data from the young, middle-aged and older adults. Most data points fall above the 1:1 line reflecting the fact that shear wave speeds in the gastrocnemius aponeurosis were generally higher than in the adjacent muscle.
