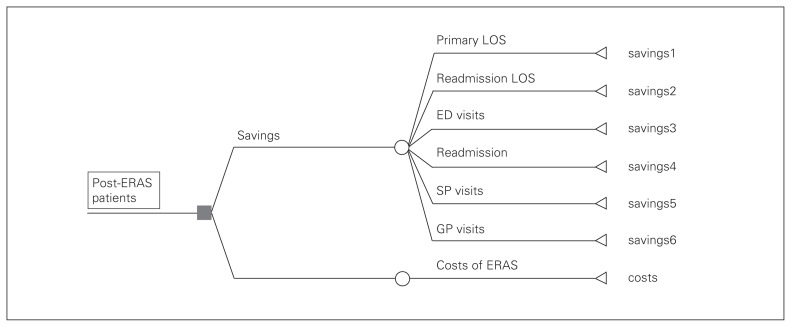
Fig. 1.
Decision tree to estimate health system savings. Savings1 = (LOS1 – LOS1 × IRR1) × c1, where LOS1 is primary LOS of pre-ERAS patients, IRR1 is the impact of ERAS on primary LOS measured by an IRR, and c1 is the marginal cost per hospital day of the primary LOS shortened by ERAS. Savings2 = (LOS2 – LOS2 × IRR2) × c2, where LOS2 is readmission LOS of pre-ERAS patients, IRR2 is the impact of ERAS on readmission LOS measured by an IRR and c2 is the marginal cost per hospital day of the readmission LOS shortened by ERAS. Savings3 = (ED – ED × IRR3) × c3, where ED is the number of ED visits of pre-ERAS patients, IRR3 is the impact of ERAS on ED visits measured by an IRR and c3 is cost per ED visit. Savings4 = (readmit – readmit × IRR4) × LOS2 × c4, where readmit is the number of readmissions of pre-ERAS patients, IRR4 is the impact of ERAS on readmissions measured by an IRR, LOS2 is readmission LOS of pre-ERAS patients, and c4 is the average cost per hospital day of readmissions prevented by ERAS. Savings5 = (SP – SP × IRR5) × c5, where SP is the number of specialist visits of pre-ERAS patients, IRR5 is the impact of ERAS on specialist visits measured by an IRR and c5 is the cost per specialist visit. Saving6 = (GP – GP × IRR6) × c6, where GP is the number of GP visits of pre-ERAS patients, IRR6 is the impact of ERAS on GP visits measured by an IRR and c6 is the cost per GP visit. ED = emergency department; ERAS = enhanced recovery after surgery; GP = general practitioner; IRR = incidence rate ratio; LOS = length of stay; SP = specialist.

