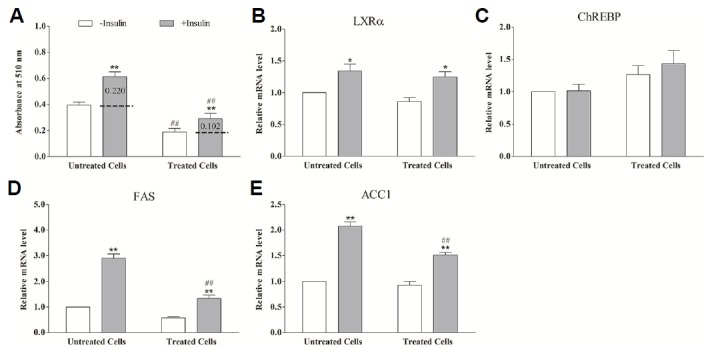
Fig. 4.

The effect of insulin on lipogenesis and genes expression in SREBP-1c blocked adipocytes. Differentiated adipocytes were shifted to a serum-free medium containing 5% bovine serum albumin for 12 h, and then transferred to the basal medium containing 20 mmol/L glucose in the absence (open bars) or presence (grey bars) of insulin for 24 h. Treated cells means the adipocytes were treated with 10 μmol/L fatostatin concomitant with insulin treatment for 24 h. Untreated cells means the cells were not treated by fatostatin. A: Quantification of lipogenesis in differentiated adipocytes by Oil Red O extraction. B–E: The relative mRNA level of LXRα (B), ChREBP (C), FAS (D) and ACC1 (E) measured by using real-time RT-PCR. * (P < 0.05) and ** (P < 0.01) mean the significant between treatments in the same cell group. # (P < 0.05) and ## (P < 0.01) mean the significant between the same treatment in different cell groups. Data are means ± SEM.
