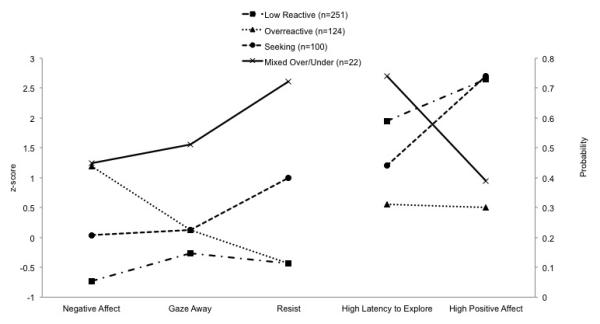
Figure 1.

Means and Probabilities of Flower Print Task Variables by Class. This figure shows the values (means and probabilities) for the five Flower Print Task variables included in the LCA for each of the tactile response pattern classes, illustrating how classes differed in their responses to tactile stimulation during the Flower Print Task.
