
Figure 2.
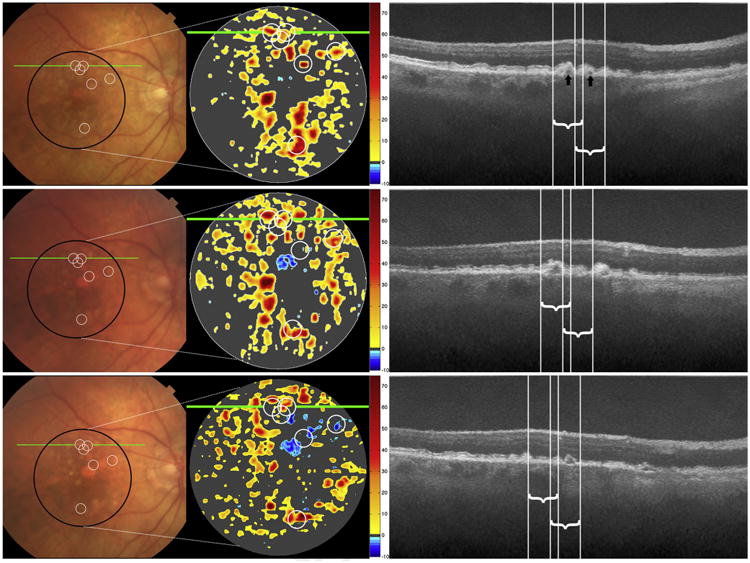
Color photographs, spectral-domain optical coherence tomography (SD OCT)—derived retinal pigment epithelium-drusen complex (RPEDC) thickness maps for the area of the black circle on color photograph, and SD OCT B-scans at the site of the green line, at baseline (top row), year 2 (middle row), and year 3 (bottom row) for a single study eye. On thickness maps, the dark gray areas designate RPEDC that is in the normal range of thickness in contrast to red and orange tones that designate areas of RPEDC abnormal thickening volume (optical coherence tomography [OCT] drusen) and blue tones that designate RPEDC abnormal thinning volume (RAT).14 Six optical coherence tomography—reflective drusen substructures (ODS)-centered regions of interest (ROIs) are shown on the color photograph and SD OCT—derived thickness map at baseline (white circles, top row) and project to the white lines on the B-scan. The white circles in the middle and bottom rows track the locations of these ROIs (not new ODS) at years 2 and 3. The ODS locations at baseline are not distinguishable on color photograph and are typically located amidst drusen and normal RPE, whereas on the thickness map they are in regions of OCT drusen. The RPEDC thicknesses of these ODS-centered ROIs follow the classic trajectory of persistence (possibly early increase) in drusen volume followed by collapse into atrophy. On the B-scans, the baseline low reflective core (ODS subtype, black arrow) on the left persists at year 2 and collapses at year 3. The low-reflective core on the right (black arrow) disappears at year 2 and transforms into another subtype of ODS, conical debris, at year 3. Although we only marked and followed ODS from baseline, the new appearance on the B-scan at year 2 of a split drusen ODS (right of the white lines) demonstrates the dynamic nature of ODS.