
Figure 1.
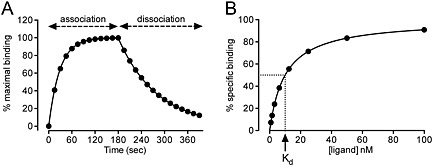
Simulated kinetic and saturation binding curves. Typical kinetic and saturation binding curves were simulated in GraphPad Prism using the association and dissociation kinetics equation (A) or one‐site specific binding saturation equation (B) for a ligand with a 10 nM Kd for a receptor. This demonstrates the difference in the data that can be generated for the same ligand depending on the assay format used. For (A), the concentration of ligand was set to 25 nM, k on to 1 x 10⁶ M−1·s−1 and k off to 0.01 M−1, which gives a Kd of 10 nM. In (B), the B max was set to 100 and Kd to 10 nM and represents total minus non‐specific binding (as determined in the presence of a high concentration of unlabelled ligand). The Kd is equivalent to the concentration of ligand resulting in 50% of specific binding.