
Figure 2.
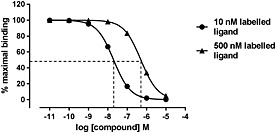
Simulated competition binding curves using two different concentrations of labelled ligand. Typical competition binding curves were generated in GraphPad Prism. The one site competition equation (which incorporates the Cheng–Prusoff correction) was used with 10 nM and 500 nM of the labelled ligand, which had a Kd of 10 nM. The IC50 values for these curves were 20 nM and 500 nM, respectively. Using the Cheng–Prusoff equation, this gives a Ki of 10 nM for the unlabelled ligand under both conditions. This demonstrates the differences in the concentration–response curves and IC50 values that can be obtained if high concentrations of the labelled ligand are used.