
Figure 3.
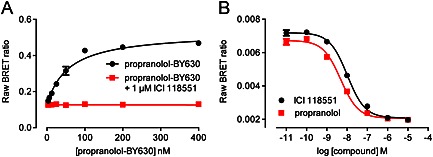
Illustrative NanoBRET saturation and competition binding curves. NanoBRET ligand binding assays were carried out using HEK293 cells stably expressing the human β2‐adrenoceptor, as detailed in Stoddart et al. (2015). (A) Cells were treated with increasing concentrations of propranolol‐BY630 (compound 18a in Baker et al. (2011)) in the presence or absence of 1 μM ICI 118551, resulting in a calculated Kd of 57 nM. (B) Cells were treated with increasing concentrations of ICI 118551 or propranolol and 50 nM propranolol‐BY630, resulting in pKi values of 8.26 and 8.59, respectively. In both cases, cells were incubated for 1 h at 37°C before the addition of 10 μM furimazine. BY630 fluorescence (>610 nm) and Nanoluc luminescence (420–500 nm) were immediately measured and the fluorescence : luminescence ratio (raw BRET ratio) was calculated. Data shown are representative of three independent experiments and are means ± SEM of triplicate values.