
Figure 5.
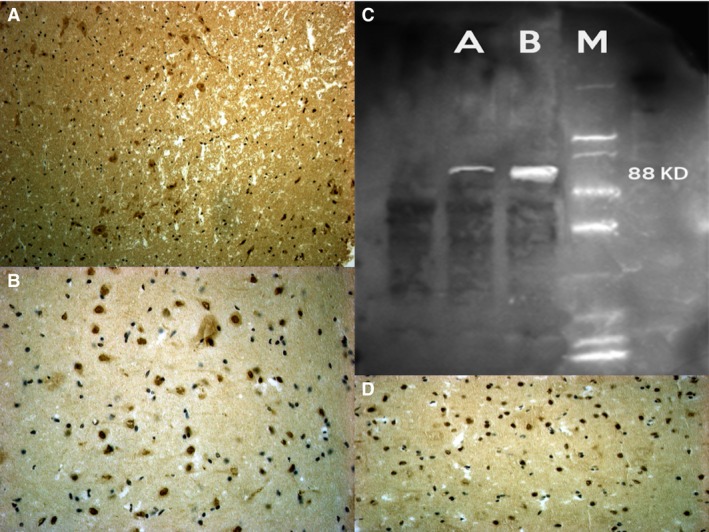
VMAT‐2 weaker reactions on the dendrites and neuronal cell bodies of treated rats compared to controls (D). In particular the most significant difference was found in striatum (A) and hippocampus (B) samples. (C) Western blot analysis detects the chemiluminescent blots of VMAT2 in the treated group.