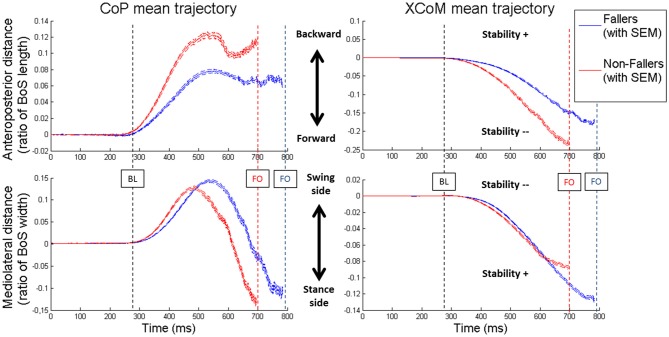
Figure 6.
Mean values of the CoP (on the left) and XCoM (on the right) trajectories from T0 to FO in Lateral targets. For both groups the two components of the movement are presented: anteroposterior (on top) and mediolateral (on the bottom). Blue lines are the results for Fallers (F) and red lines for Non-fallers (NF). The lines represent the mean value and the standard error to the mean (SEM). For clarity, the BL is the mean of the two groups. Note that for the anteroposterior displacement of the XCoM (top right) the less negative the XCoM indicates a better stability while for the mediolateral displacement of the XCoM (bottom right) the less negative XCoM indicate a worst the stability. For this representation, the base of support (BoS) width has been calculated between the positions of the two 5th metatarsal head markers, along the mediolateral axis.

