Figure 2.
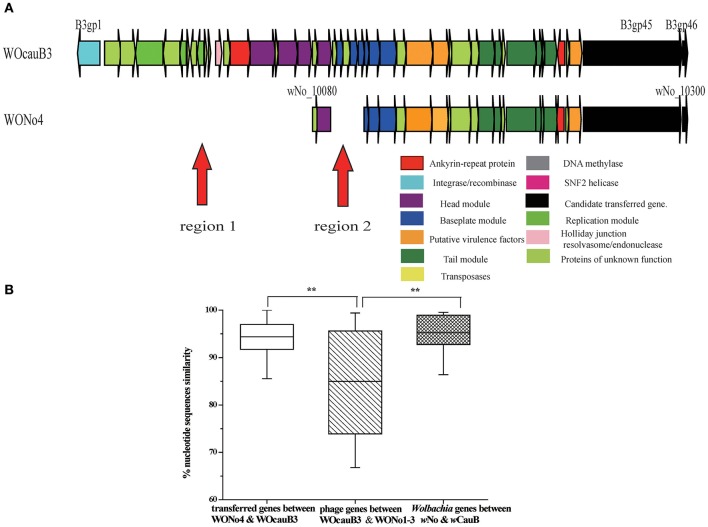
Phage WO transferred between wCauB and wNo. (A) Structural comparison between the WOcauB3 and WONo4 prophage sequences. Red arrows indicate discrepant regions between the prophage genomes. Genes are presented by arrows while psudogenes and non-coding regions are boxes. Genes are colored based on functional type and homology. (B) Percent nucleotide identity between prophage genes encoded on WOcauB3, WONo4, and other phages. Percent nucleotide identity is compared between phage genes transferred from WOcauB3 (between WOcauB3 and WONo4), other phage genes (between WOcauB3 and WONo1, WONo2, WONo3 in wNo that are likely not transferred from WOcauB3), Wolbachia genes (wNo and wCauB previously sequenced protein-coding genes). Error bars represent one standard deviation. The double asterisk indicates a significant difference (P <0.01; Mann–Whitney U, two-tailed test).

