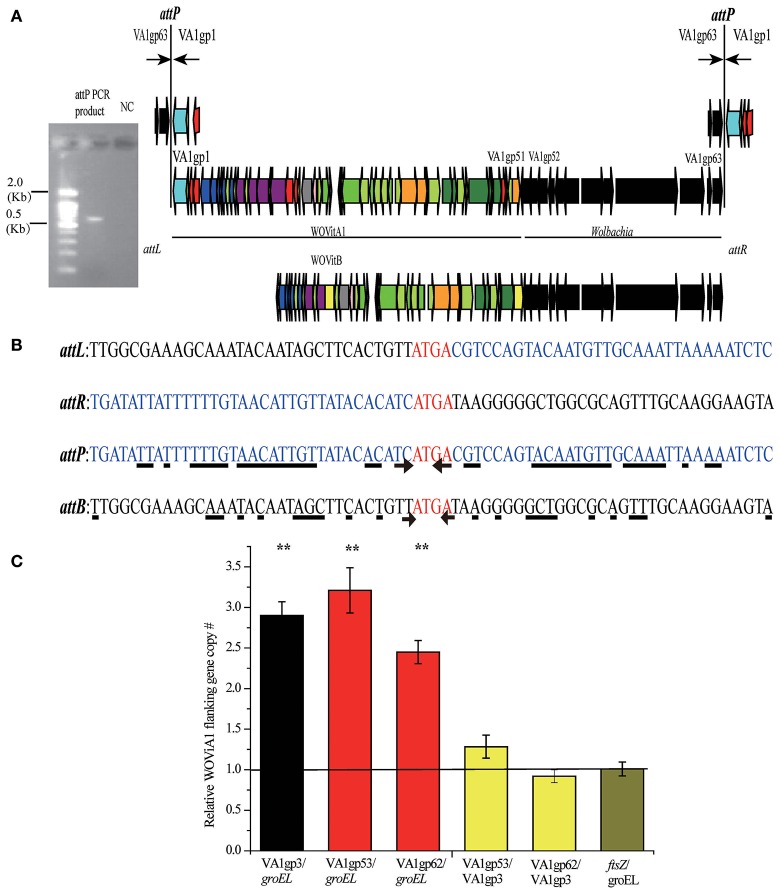
Figure 5.
Determination of WOVitA1 prophage region. (A) attP PCR product, a 0.6 kb PCR product containing the WOVitA1 attP region. NC, negative control with distilled water as template. Black arrows show the locations of outward primers. Genes are presented by arrows while psudogenes and non-coding regions are boxes. Colors of ORFs are as described in the legend of Figure 2. (B) Alignment of the attP PCR product sequence and the wVitA sequence. The arrow indicates the beginning of the inverted repeat sequences, the underline shows nucleotide which we can find the corresponding inverted repeat sequences beside the core sequence. (C) Relative copy number of defined prophage WOVitA1 region, prophage WOVitA1 flanking region, and wVitA of N. vitripennis. Relative copy number of ORFs encoding genes groEL and ftsz represented wVitA, VA1gp3 represented prophage WOVitA1, and VA1gp53 and VA1gp62 represented WOVitA1 flanking region were measured by real-time qPCR. The black line (number one) depicts the expected copy number. Error bars represent one standard deviation. The double asterisk indicates a significant difference (P < 0.01; two-tailed t-test).

