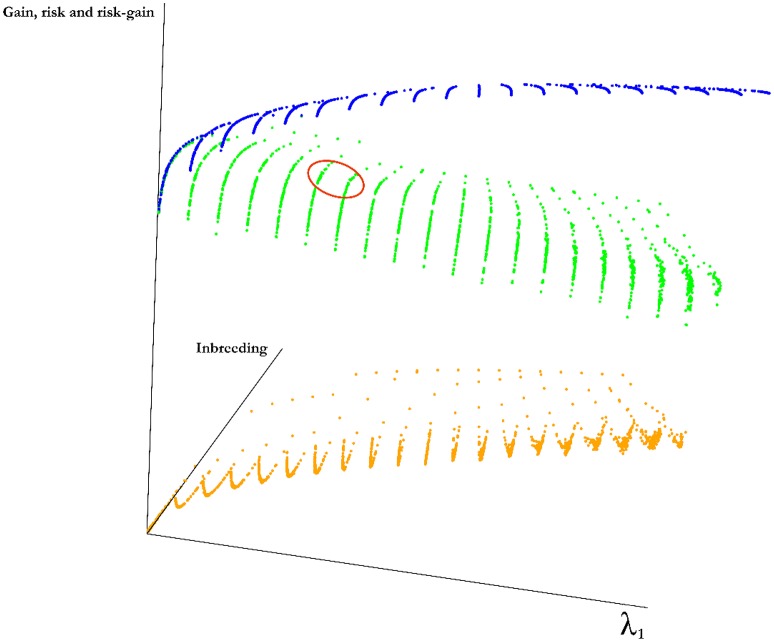
Figure 3.
Frontier surface for a simulated population. A marker data was created for 50 genotypes by randomly generating 1000 markers for each genotype. By introducing independent and identically normally distributed marker effects at 500 of randomly selected the loci we have defined a trait. Three surfaces are given in the figure. The blue surface represents the optimal values of the objective function in Equation (2). Points below this surface correspond to sub-optimal regions and points above this surface are unattainable. The points along the surfaces are the optimal points balancing gain, risk and inbreeding. The green surface is the expected average genetic value of the progeny and the orange surface is the value of the cross-variance term, these two surfaces add up to the blue surface. Although, it is not possible to determine a best value for the parameters λ1 and λ2, a reasonable region for this particular experiment is marked by a red ellipse, this is the region in which the rate of increase in inbreeding per unit gain increases sharply and obtaining additional cross variance after this point requires a large decline in gain.

