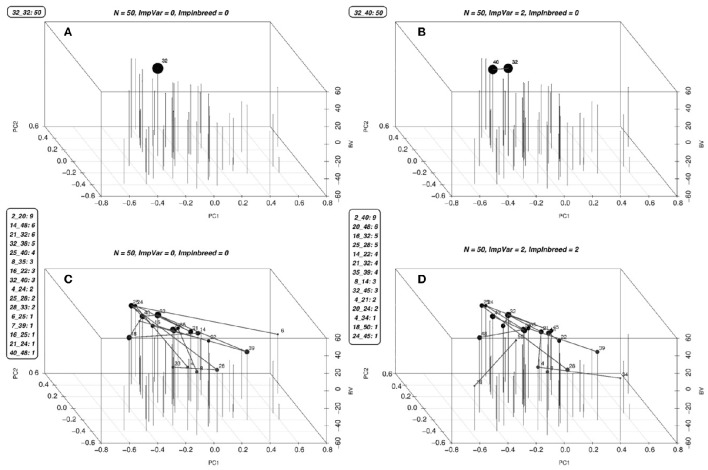
Figure 4.
Optimal solutions for a simulated population. Optimal solutions to the mating problem at a few selected values of λ1 and λ2 are in (A–D). The list of mates and the number of crosses for each mate is given along the figures. The first two coordinates are used to display the genetic relationships of the lines using the first two principal components, the third coordinate displays the BV's of the parents. Each parent is represented by a vertical bar. The lines between the vertical bars represent the matings and the size of the points on the bars are proportional to the number of crosses between that parent and any other. Since the mating algorithm is discrete and the number of genotypes contributing to the next generation increase starting from one as we increase the λ2, we can identify a point to operate on this surface by slowly increasing the λ2 until a desired minimum number of genotypes are included in the solution.

