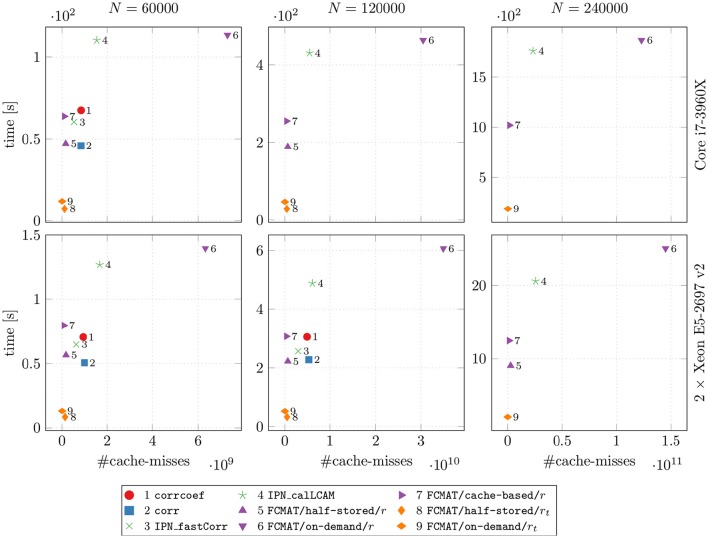
Figure 3.
Speed vs. cache misses. The compared programs for degree computation and the two machines on which the comparisons were conducted are the same as in Figures 1 and 2. The reported results are averages from 10 runs on each machine. The number of timepoints T was fixed at T = 256. N: number of nodes; time [s]: elapsed time in seconds.

