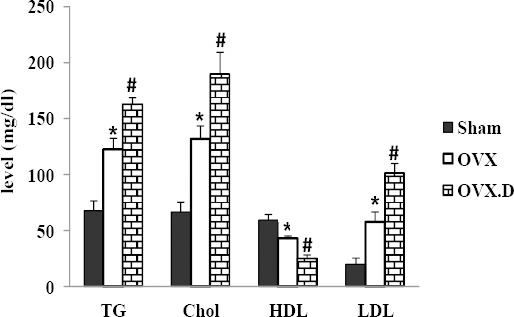
Figure 1.

Biochemical measurements after the 8-week experiment
OVX: ovariectomized group, OVX.D: ovariectomized with 8-weeks diabetic group. Data are expressed as mean±SEM
* Significant difference compared with the sham group (P<0.05)
# Significant difference compared with sham and OVX groups (P<0.05)
