
Figure 3.
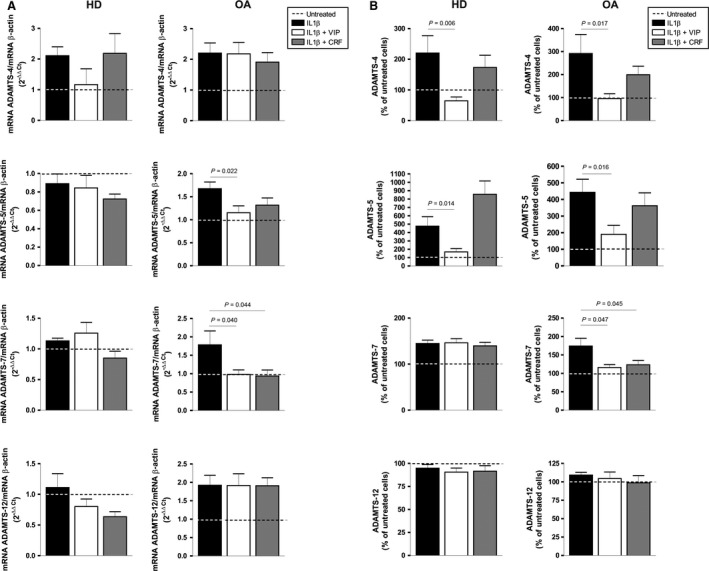
mRNA and protein expression of ADAMTS in IL‐1β‐induced OA‐SF in the presence of VIP or CRF. (A) ADAMTS‐4, ‐5, ‐7 and ‐12 mRNA expression after 24 hrs of treatment was measured by RT‐qPCR, normalized to β‐actin mRNA expression and presented as the relative quantification with respect to the untreated cells using the formula 2−∆∆Ct (see Patients and methods). Values are presented as the mean ± S.E.M. of HD (n = 4) (left) and OA (n = 7) (right), performed in triplicate. (B) The presence of ADAMTS‐4, ‐5, ‐7 and ‐12 in the supernatants was determined by ELISA after 24 hrs of treatment. Values are presented as the percentage of untreated cells (mean ± S.E.M.) of HD (n = 4) (left) and OA (n = 7) (right), performed in duplicate. Dashed lines represent the untreated condition. Significant differences between treatments are indicated by a bar with the P‐value above.