
Figure 1.
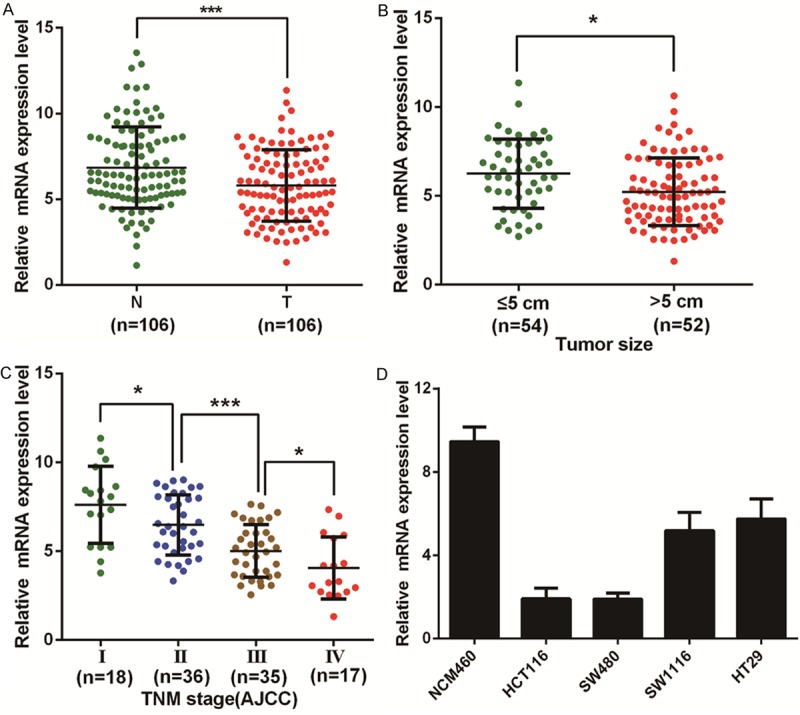
Expression of miR-193b in CRC tissues and cell lines. (A) The transcription level of miR-193b in 106 matched CRC tissues (T) and adjacent normal tissues (N) as measured by RT-qPCR. B, C. The relationship between miR-193b and clinicopathological characteristics, such as tumor size (B) and TNM stage (C). (D) Histograms of the transcription level of miR-193b in CRC cell lines and normal colonic epithelial cells (NCM460). The results are shown as the mean ± SEM (*P<0.05, ***P<0.001) of triplicate determination from three independent experiments.