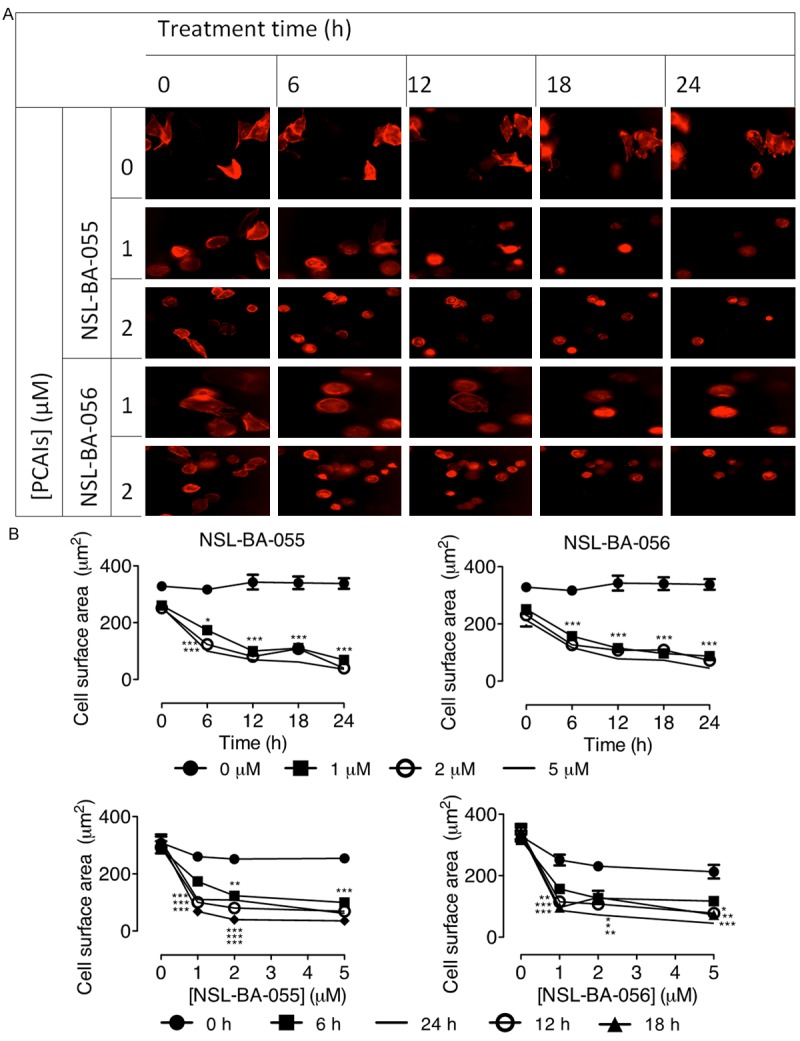
Figure 6.

PCAIs alter pancreatic cancer cell morphology by disrupting F-actin filaments. Transfected MIAPaCa-2 cells were treated for 24 h with the indicated concentrations of PCAIs and their effect on F-actin expression was quantified by measuring the cell surface areas using Nikon NIS-Elements software. A: Representative images of treated and untreated control cells were captured at 20 × magnification using Nikon Eclipse Ti Microscope at the indicated time points. B: Cell surface area at various treatment time intervals (upper panels) and concentration after 24 h treatment (lower panels). The results are expressed as the means (± SEM, N = 15-20). Statistical differences between the treated and untreated controls were determined by Tukey post-test comparisons. Significant differences are shown by *P < 0.05; **P < 0.01 and ***P < 0.001.
