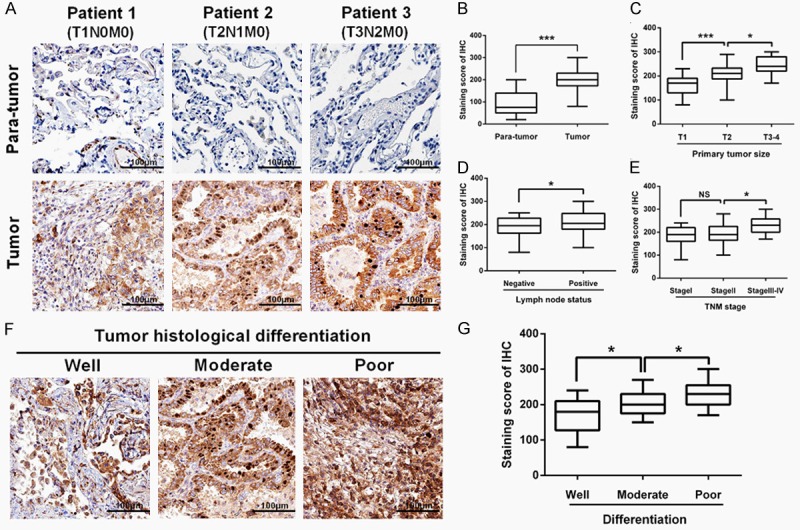
Figure 2.

Immunohistochemistry analysis. A and B. The FAM83D staining score was significantly increased in LUAD tissues (201.0±6.096) compared with adjacent normal tissues (91.17±6.861). C-E. The FAM83D staining score was significantly increased along with more advanced T stage, N stage and TNM stage in LUAD tissues. F and G. Poorly differentiated LUAD samples showed higher FAM83D protein expression, compared with those well-differentiated LUAD samples. *P<0.05, **P<0.01, *** P<0.001, NS: No significance.
