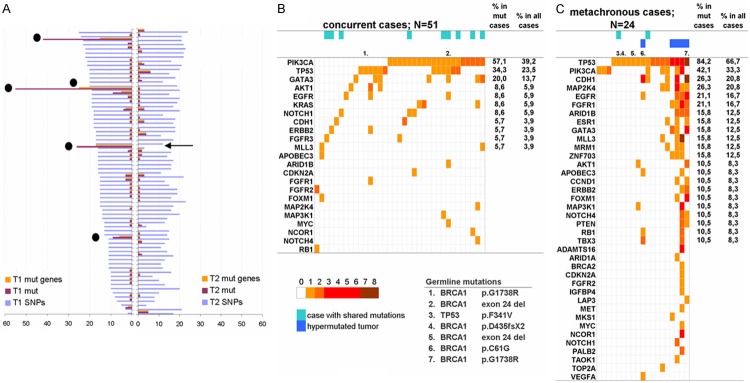
Figure 3.
Mutation patterns in concurrent and metachronous BBC. (A) Distribution of mutations and mutated genes in tumors of both sides. SNP numbers are shown for comparison of sequencing performance of the samples; these did not differ for samples in side 1 vs. side 2 (Mann-Whitney P=0.5656) and showed a good correlation upon bivariate comparisons (Spearman’s rho 0.641; P<0.0001). The matched tumor was not available in one of the hypermutated cases (arrow). (B and C) mutation maps in concurrent (B) and metachronous (C) cases. The number of mutations per gene is indicated on the color scale. Indicated are germline mutations; hypermutated tumors; tumors with shared mutations. Most frequently mutated gene in concurrent samples is PIK3CA, followed by TP53 and GATA3. Metachronous tumors carry more frequently mutations in TP53, followed by PIK3CA and CDH1.

