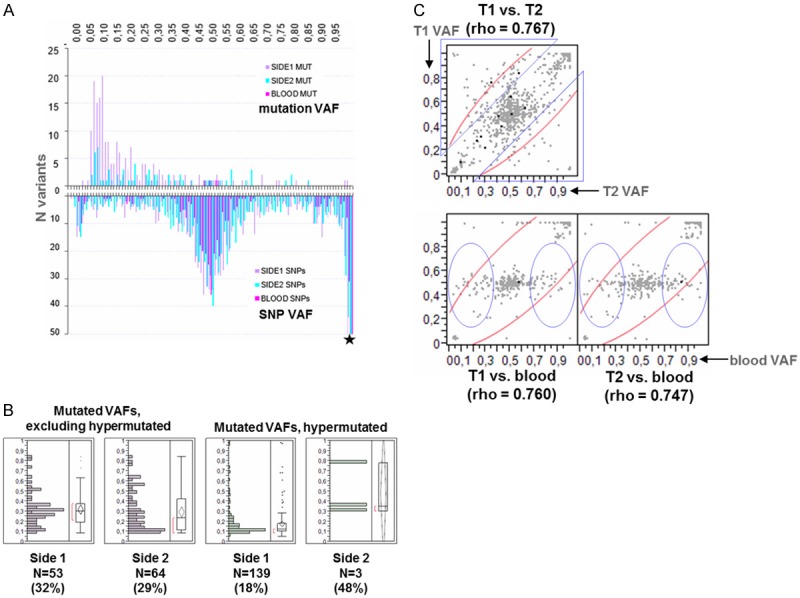
Figure 4.

Bilateral comparisons of Variant Allele Frequencies (VAFs). A. VAF distribution for coding mutations and SNPs in both sides and in the germline. Germline variants as identified with the tissue panel. VAF distribution for coding mutations was skewed towards 0, with mean (median) values of 21% (14%) in side 1 and 30% (21%) in side 2. Most mutation VAFs were <25%, particularly in Side 1. B. Coding mutation VAFs are significantly lower in hypermutated as compared to non-hypermutated tumors (Mann-Whitney P<0.001). Numbers in parentheses: mean values for VAFs. N: number of mutations. Note that the contralateral tumors paired to hypermutated ones exhibited only one mutation in 3 out of 4 comparable cases, although they were diagnosed years later after the hypermutated tumors. C. Bilateral correlations of SNP VAFs in matched samples. Tumors in side 1 (T1) and in side 2 (T2) were compared with each other and with germline. SNPs were identified with the tissue panel. Triangles and circles: altered zygosity for these SNPs. Spearman’s rho values yielded P’s <0.0001 in all comparisons.
