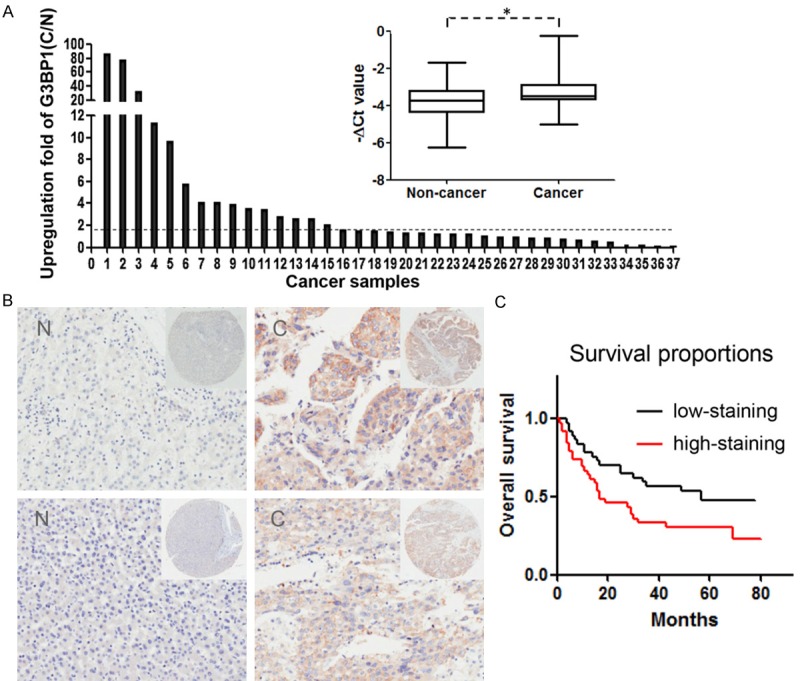
Figure 1.

G3BP1 expression is upregulated in human HCC samples. A. The expression of G3BP1 in 37 matched pairs of HCC and non-cancerous tissues was detected by quantitative real-time PCR where β-actin was used as internal control (right), P value as indicated was calculated by paired t test. *P<0.05. The change fold (C/N) of G3BP1 expression in each sample pair was respectively indicated as a column (left). B. The protein expression of G3BP1 was performed with immunohistochemical staining on a HCC tissue microarray. Two representative clinical cases of immunohistochemical staining are shown. Magnification: ×40 (upper right) and ×200 (bottom). C. The result of Kaplan-Meier survival analysis exhibited that patients with high expression of G3BP1 (red line; n=39) had shorter overall survival time than those with low G3BP1 expression (black line; n=37; P=0.02, Log-rank test).
