Figure 1.
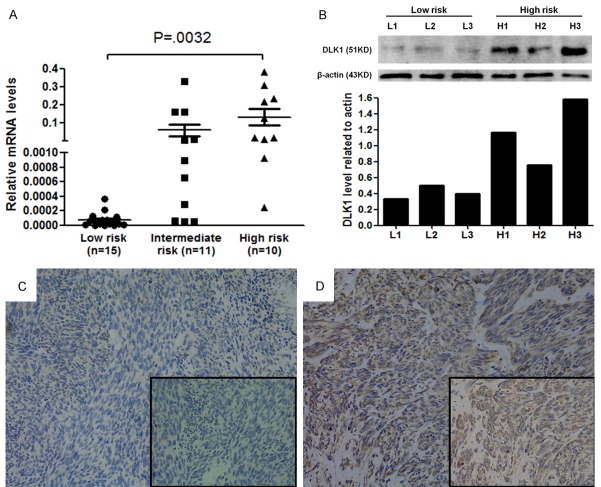
DLK1 expression in GIST tissues. A: DLK1 mRNA levels in GIST tissues of high-risk group were significantly higher than those of low-risk or intermediate-risk group (P = 0.008 and P = 0.039). B: DLK1 protein expression in 3 low-risk and 3 high-risk GIST tissues. C: Representative image of no DLK1 expression in GIST tissues was defined as negative staining. Original magnification: ×200. D: Representative images of strong DLK1 expression in GIST tissues were defined as positive staining. Original magnification: ×200.

