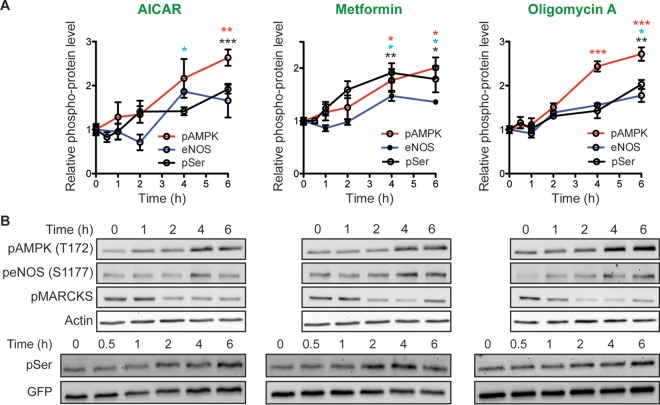
FIG 5.
Activation of AMPK signaling phosphorylates K-Ras. MDCK cells stably expressing mGFP–K-RasG12V were treated with 5 mM AICAR, 5 mM metformin, or 0.5 μM oligomycin A for the indicated times, and cell lysates were immunoblotted for phospho-AMPK (pAMPK; T172), phospho-eNOS (peNOS; S1177), phospho-MARKCS (pMARCKS), and phosphorylated K-Ras as described in the legend to Fig. 1D. (A) The graphs show the mean phosphorylated AMPK, eNOS, and K-Ras levels ± SEM from three independent experiments. Significant differences between control (vehicle-treated) cells and drug-treated cells were assessed using a one-way ANOVA test (*, P < 0.05; **, P < 0.01; ***, P < 0.001). (B) Representative blots are shown, with actin and GFP blots being used as loading controls (top and bottom, respectively).

