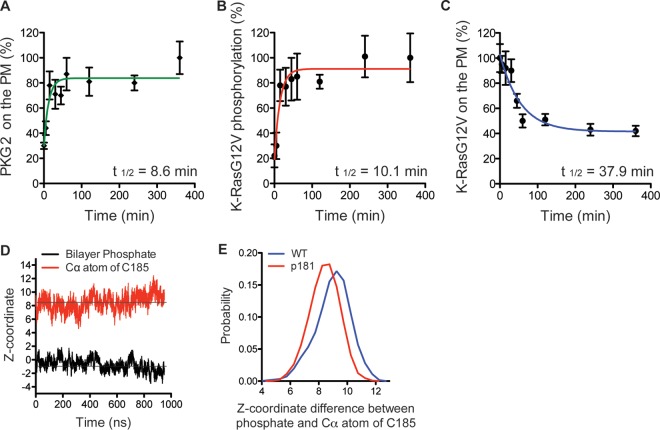
FIG 7.
Phosphorylation at Ser181 does not directly dissociate K-Ras from the PM. (A and C) Intact PM sheets from BHK cells expressing PKG2-mGFP (A) or mGFP–K-RasG12V (C) and treated with 500 μM 8-Br-cGMP over a time course were labeled with anti-GFP–4.5-nm gold. The PM levels of each protein were assayed as the mean number of gold particles per square micrometer ± SEM (n = 20 PM sheets). Values were normalized to the values at 0 min and 360 min for K-RasG12V and PKG2, respectively. (B) PM sheets from BHK cells coexpressing mGFP–K-RasG12V S181D and mCherry–K-RasG12V and treated with 500 μM 8-Br-cGMP over a time course were labeled with anti-GFP–6-nm gold and anti-RFP–2-nm gold, respectively. The extent of coclustering was analyzed using bivariate K-functions, summarized as LBI values, and used as an estimate of the extent of phosphorylation by calibration with a positive-control LBI value as described in the legend to Fig. 5A. Each data point is the mean for ≥20 PM sheets ± SEM. (D) Time evolution of the average z-position of the C-α atom of the farnesylated cysteine (red) of phospho-tK and that of the phosphate group of the lipids (black), which is centered to zero. The average for the four peptides in the system was calculated. (E) Distribution of the difference between the z-position of the phosphate group of the bilayer and that of the C-α atom of farnesylated cysteine in wild-type (WT) tK (blue) and phospho-tK (p181; red). The left-shifted distribution of phospho-tK indicates deeper bilayer insertion.

