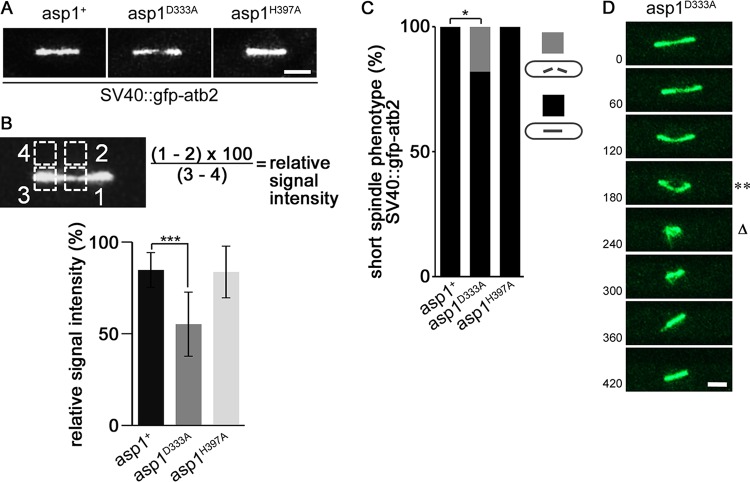
FIG 1.
Asp1-generated IPPs control spindle midzone stability. (A) Photomicrographs of asp1+, asp1D333A, and asp1H397A cells with a short (3- to 5-μm) spindle expressing SV40::GFP-Atb2+. Bar, 2 μm. (B) Quantification of the fluorescence signal of the spindle midzone. The thinnest part of a spindle midzone was measured (square 1), and the fluorescent background was subtracted (square 2). For relative signal intensity this value was set in relation to the fluorescence signal of a spindle end (square 3) minus fluorescent background (square 4). Relative signal intensities of spindle midzones: asp1+, 84.7 ± 9.5; asp1D333A, 55.1 ± 17.5; and asp1H397A, 83.6 ± 14.1 (n = 9/strain; ***, P < 0.0005 as determined by two-sample t test). (C) Quantification of spindle phenotypes (gray and black bars show broken and nonbroken spindles, respectively) determined for the indicated strains expressing SV40::GFP-Atb2+ (asp1+ strain, n = 24; asp1H397A strain, n = 22; asp1D333A strain, n = 17; *, P < 0.05 as determined using χ2 test). (D) Representative example of an asp1D333A SV40::GFP-Atb2+ cell. Time between images, 60 s. Bar, 2 μm. **, collapsing spindle; Δ, broken spindle.

