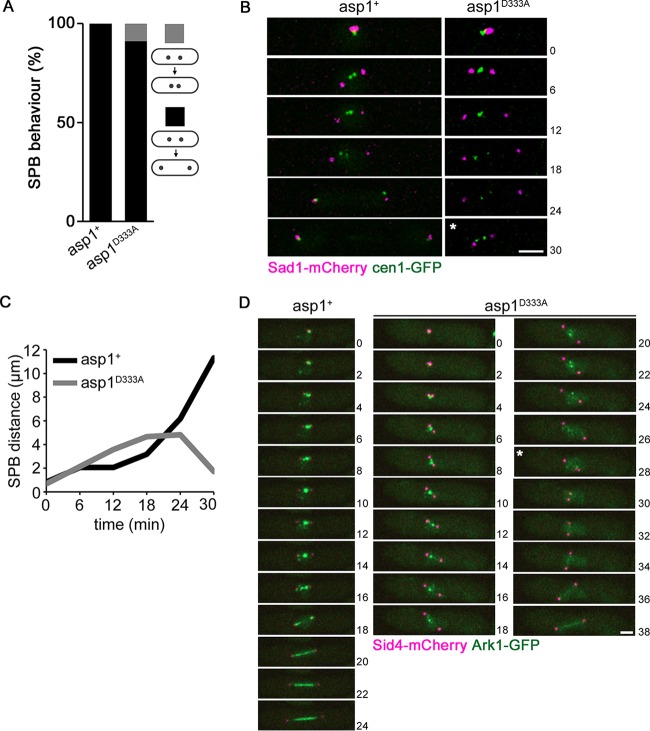
FIG 3.
Spindle breakage occurs prior to sister chromatid segregation. (A) Quantification of SPB segregation phenotype determined for the indicated strains expressing cen1-gfp Sad1-mCherry (asp1+ strain, n = 31; asp1D333A strain, n = 45) (gray and black bars show collapsing and noncollapsing spindles, respectively). (B) Time-lapse images of mitotic asp1+ and asp1D333A cells expressing cen1-GFP Sad1-mCherry. Time between images, 6 min. Bar, 2 μm. *, time of spindle collapse. (C) Diagrammatic representation of the Sad1-mCherry images shown in panel B. (D) Localization of Ark1-GFP and Sid4-mCherry (= SPB position) in mitotic asp1+ (left) und asp1D333A (right) cells. Spindle collapse (*) was observed in the asp1D333A cell. Time between images, 2 min. Bar, 2 μm.

