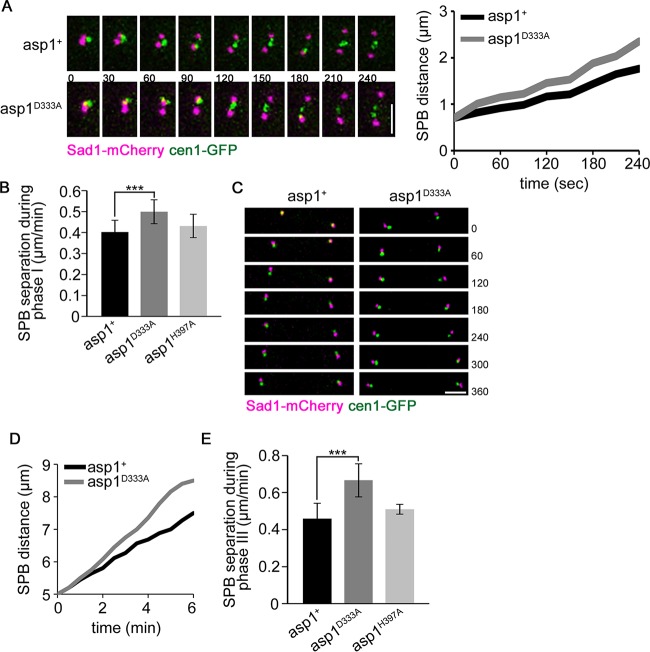
FIG 4.
Spindle phases I and III are modulated by Asp1 kinase activity. (A) Left, live-cell imaging of Sad1-mCherry cen1-GFP-expressing wild-type (asp1+) and asp1D333A cells during prometaphase (t = 0 is first separation of SPBs). Time between images, 30 s. Bar, 2 μm. Right, distance between SPBs shown diagrammatically. (B) Diagrammatic representation of SPB separation speed during spindle phase I (n = 20/strain; ***, P < 0.0005 for the asp1D333A strain compared to the asp1+ strain [two-sample t test]). (C) Merged images of a wild-type (asp1+) and an asp1D333A anaphase B cell expressing Sad1-mCherry cen1-GFP. Time between images, 60 s. Bar, 2 μm. Cells with centromere signals with 5-μm distance (t = 0) were monitored by time-lapse microscopy to determine the speed of SPB separation. The time between images was 1 min, and cells were photographed for 6 min. At this time the average SPB distances were 7.5 and 8.5 μm for asp1+ and asp1D333A cells, respectively. (D) Diagrammatic representation of SPB separation of the cells shown in panel C. (E) Quantification of SPB separation during spindle phase III of the indicated strains: asp1+ strain, 0.46 ± 0.08 μm/min; asp1D333A strain, 0.67 ± 0.09 μm/min; asp1H397A strain, 0.51 ± 0.03 μm/min (n = 13/strain; ***, P < 0.0005 for the asp1D333A strain compared to the asp1+ strain [two-sample t test]). Start of measurement, separated cen1-GFP signal and a spindle length of 5 μm. Endpoint of measurement, 6 min after start of measurement.

